Legal Cannabis Access and Medical Cannabis Access Points

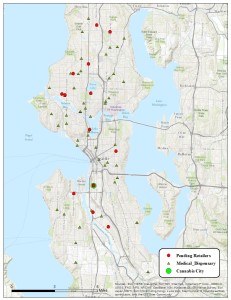
Active_Pending_Medical Seattle Map 07162014


Map by Steve Hyde, CASP Geographic Information Specialist  and Steven Wan, CASP GIS intern

by Dominic Corva, Executive Director

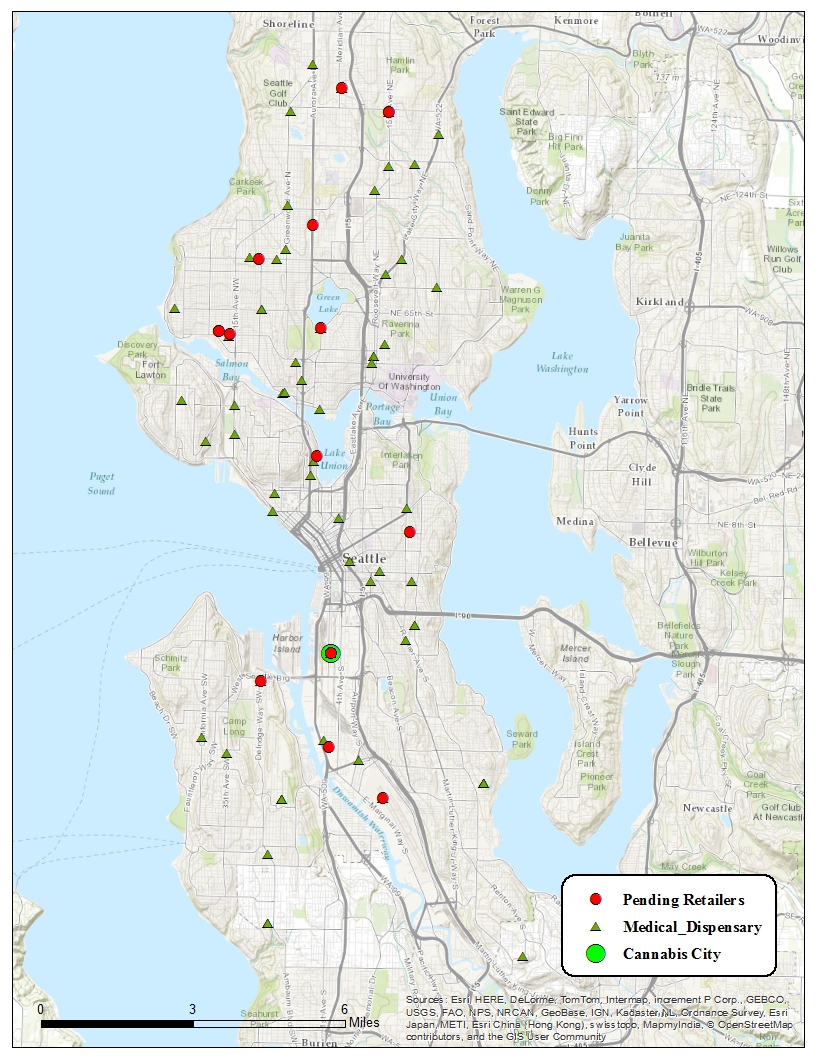
How accessible are legal cannabis retail stores relative to medical cannabis access points?  This is a very important question for policymakers and the public. although we are about four months away from folks realizing just how much since the current deadline for medical access point transition is January 1.

CASP located 96 medical access points listed by Weedmaps, accessed on May 15 by our intern Nathan Ogden.  This is a lot less than the actual access point count which could be upwards of 300 in the Seattle area, but the ones that aren’t advertising are probably the first to go out of business — or don’t want to be listed.  Twelve of these were listed as delivery service-only, and one of those (Winterlife) has recently made a judicious decision to “go medical” instead of advertising themselves as a legal delivery service.

We mapped these access points along with the 21 retail lottery winners from March so that we can begin to discern the relative accessibility access points vis a vis the legal retail landscape.  We can now address the question through a preliminary analysis that addresses its significance to policymakers and the public.

In December 2013, as the legislative session approached, many policymakers claimed that I-502 retail stores would made medical access points unnecessary before a single retail store opened.  These claims reflected the problematic discourse that patients (and the problematic category most politely referred to as “gamers of the system”) will have safe access through the legal system.  Since the end of the short legislative session in February we haven’t see these claims in the media, but by January 1 such claims will undoubtedly pick up where they left off.

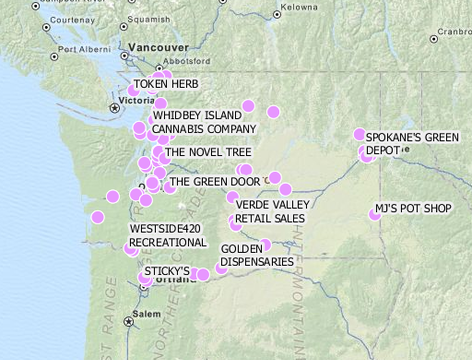
The map is quite clear and supports Pete Holmes’ public statements in support of more retail stores in Seattle proper, where according a recent RAND study about a third (see p 26 of the study) of the states legal consumption resides:  medical cannabis access points are far more accessible than legal retail.

Legal Cannabis access, of course, matters beyond the question of whether it is acceptable in the near future to shut down all medical cannabis access points because Washingtonians can now visit the scattered smattering of legal retail locations most of which will experience supply problems in the next six months or so.

It also matters to legal cannabis consumers in Washington State.  This is not the same as Washington State cannabis consumers.  I cannot stress this enough:  I-502’s goal to capture black market consumption is a LONG TERM goal, and anyone who considers I-502 to be failing right now because it doesn’t affect the black market needs this reality check badly.

Our working hypothesis is that until prices come down significantly, legal retail cannabis consumers will consist of tourists; existing cannabis consumers with discretionary income and an ideological commitment to supporting the new legal market; and new cannabis consumers whose main impediment to prior consumption has been its legality.  This hypothesis was first stated by Dr. Corva over a year ago in the Aggarwal, Sexton, Corva and Mandel application for the Washington State cannabis consulting gig won by BOTEC, but more recently evidence has been presented to support it, by Jake Ellison in the Seattle Times Pot Blog.

So this next hypothesis is based on a long term interest by I-502-supporting public and policymakers in locating retail stores near potential customer bases, when the price comes down to the kind of parity that would start to capture existing cannabis users.  The hypothesis is that existing medical cannabis access points are currently located in very specific places where (a) they won’t be driven out by NIMBYs; (b) the existing local social order finds cannabis retail acceptable and (c) property is cheap/landlords find their risk manageable.  All of these conditions are also good ones for properly zoned potential legal cannabis retail locations.

A fourth condition is possible but insupportable with existing evidence:  current medical access points are located close to cannabis users.  The tendency for access points to cluster in low-income and industrial neighborhoods may reflect the lower income tendencies of daily cannabis users (again see the RAND report, which is a rich update of the research initiated by BOTEC last summer, and co-authored mostly by BOTEC veterans).

All users may find this map and others like it useful for thinking about where to locate retail cannabis stores in the future.  We will be updating this analysis as more data comes in.
 

Public Transit and the Legal Retail Landscape 1.0

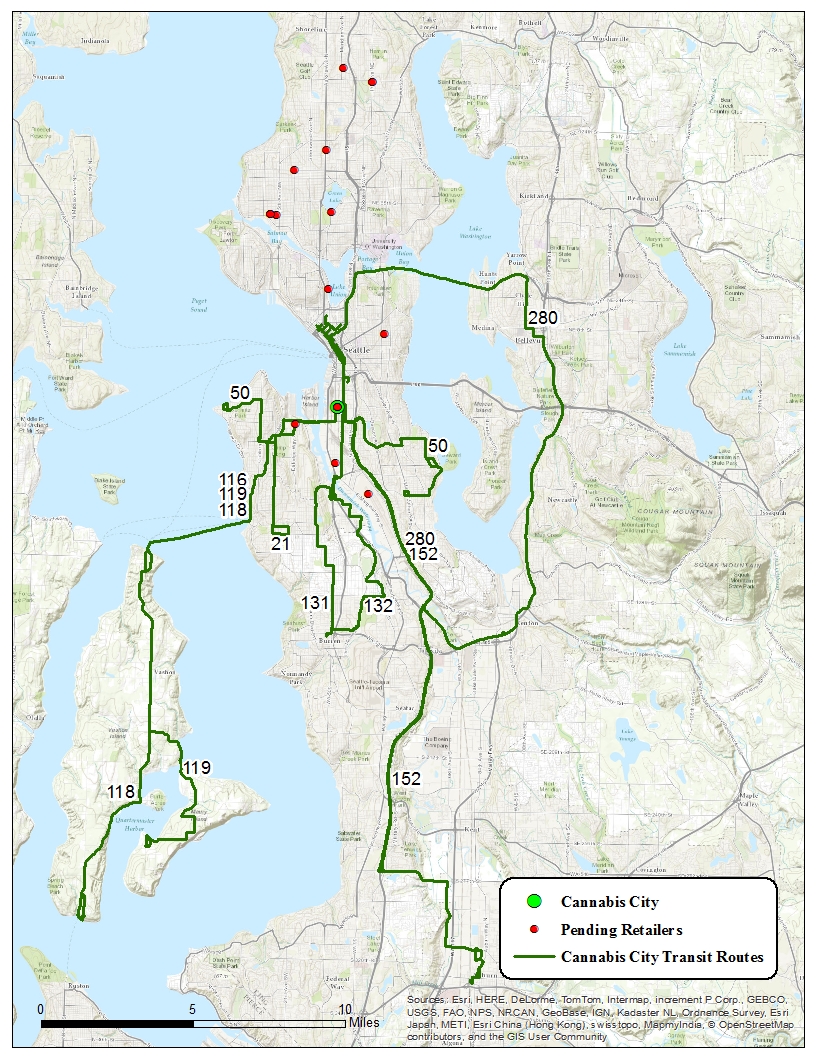
Final Retail Transit Map 07162014

Map bySteve Hyde, CASP Geographic Information Specialist  and Steven Wan, CASP GIS intern

by Dominic Corva, Executive Director

How accessible is legal retail cannabis in Seattle?  This map represents our first representation of the spatial relationship between public transit bus routes and legal cannabis retailers.  We begin with Seattle, but will expand to King County and other metropolitan areas as we go along.  For now, the map highlights Cannabis City (which opened and then closed last week, but still) and the other 20 lottery location “winners” that may be (a) approved but not open yet (b) still in the process of approval or (c) moved somewhere else, whether through business acquisition and relocation or straightforward relocation.  Given how clustered the lottery winners are, it would make a great deal of sense to locate properly zoned property in, for example, the U District.

For now, all of the bus routes that have stops within 1000 feet of “active” cannabis retailers are listed.  As this landscape evolves, we will tighten our criteria and add routes near activated stores.

Special thanks to Steven Wan, our CASP GIS intern, for getting this off the ground!

Active Legal Production Analysis in Washington State Part IV: Shortages in social context

Since the publication of this post, we have been alerted that our assumption that most active Tier 3 producers are not indoor may be way off.  Blaine Stum, a researcher with the Spokane Marijuana Policy Working Group, reports that according to his research so far 7 out of the 8 Tier 3’s approved before May 1 may be indoor.  We will adjust our analysis going forward, but keep this in mind for now — Dr. Corva, 7/19/2014

by Dominic Corva, Executive Director

Part III of our analysis of Washington State’s active legal production landscape ended with the following conclusion and question:

Our extremely provisional calculations thus work out to a maximum of 86,800 square feet of active legal canopy that could have been harvested by now.  That’s a far cry from the approximately 800,000 square feet of canopy figure being cited as approved in the news, and explains a bit better (a) why supply is so limited and (b) the rate at which it can be expected to increase.

How do these number translate into pounds, and can we refine our assumptions to learn more?

Let’s pick up where we left off, on the verge of calculating available supply in terms of wholesale pounds, which is a more useful unit for understanding wholesale supply than retail grams, on the one hand, and metric tons on the other.

The WSLCB’s original calculations anticipated that 2 million sq ft of canopy = 40 metric tons of useable flower and 40 mt of raw material for concentrate.  Simple math leads us to the conclusion that they expected 25 square feet of canopy (5 ft by 5 ft, or a really abstract average plant size to yield 1 lb of flowers and 1 lb of useable byproduct (trim, shake, and kief).

If we have approximately 86,800 square feet of active canopy that could have produced by as of July 8, that means our maximum estimated available supply right now could be in the range of 3,472 lbs of useable flower and 3,472 lbs of raw material for concentrates and edibles.  Let’s throw out the latter figure for now, since only one processor has been produced and as of today as far as I know their product is not available in any retail stores yet.

So the question is, where are those lbs of product?  By our calculations, that’s the maximum possible production we could have right now if all producer/processors had to deal with was getting approved.  There are several useful responses to this question.

1.  CASP estimates are based on partial and extremely fallible information and assumptions.  This is definitely true, but even if our conservative estimates are off significantly, we don’t seem to have even 100 lbs to market at this time.

2.  Producer/processors are building/hoarding inventory for any number of reasons, including taking advantage of retail shortages to extract windfall prices even higher than reported so far by CASP.  This is definitely true:  I gave Cannabis City’s James Lathrop two phone numbers the day before he opened.  Kouchlock was able to provide a pound at $4500, but my other source refused to sell James any at this time.  I spoke with that source’s close associate not long after, and there may be more to it than the conversation indicated, including the possibility that their inventory may not have passed quality inspection.  In addition, I am aware of at least one producer/processor whose inventory-clearing price at the moment is $10,000/lb.  Finally, there is at least one active processor whose business plan is predicated on buying up all available inventory and monopolizing market supply.  While this makes sense as a short-term money-maker, I doubt the viability of such an effort since (a) that’s a business plan that builds an extra 25% excise tax into the price structure and (b) I don’t know why anyone would want to do business with them for long.

3.  Sourcing networks simply haven’t been developed yet.  This is definitely true.  Yours truly had more active producer sources for Cannabis City than James had, the day before he opened.  Another approved retailer just outside King County that is just getting their business logistics together not only didn’t have a list of active producers and their phone numbers, but wasn’t yet sure what wholesale prices they were looking at, as of Sunday evening.  I have also recently become aware of a private sector market clearing web site in development, so stay tuned.

4.  Critics of the supply “shortage” in real life exclusively blame the problem on I-502 itself, Washington State policymakers, and the Liquor Control Board.  They cite onerous regulations, slowness in the process and poor timing to worry about (a) a very real shortage of product in open retail stores right now and (b) whether this means the black market wins and by extension I-502 fails.

The CASP Reality Check: There’s far more to the “success” or “failure” of active production than simply getting LCB approval, and the development of a sustainable legal cannabis market depends on a wide array of variables (see Part I in this series).  The retail shortage is not just the result of the supply shortage, because the supply shortage is not just the result of formal I 502 implementation.

We can identify many shortages beyond the control of government officials, but I will single out two: real estate and competence.

(a) There is a legal cannabis real estate shortage because despite zero government interference, most landlords will not rent space for production because they fear federal intervention, property seizure, or other a host of other things.  Even properties that meet I-502’s stringent zoning requirements have to have a willing landlord to become part of the landscape, and the fact is that most landlords will not touch legal cannabis.

Those that do have inflated their prices substantially, for the most part.  In addition to opportunistic rentierism, however, competition from shady (and clean) financial interests bids up prices on 502-compliant properties.  These added — and often unexpected when property gets bought out from under them by real estate and financial speculators.  This is a rampant problem and may be a more significant contributor to higher costs of business and the “I-502 shortage” than any other factor.

(b) There is a competence shortage amongst existing approved I-502 producers.  I (mostly) don’t mean to imply that producers are not capable.  I mean producers are making decisions in a knowledge vacuum because this has never been done before on the one hand and with a huge degree of uncertainty from week to week what can be happening and when.  Just like the WSLCB, their “incompetence” is a side effect of creating something from nothing that has ever been done before (Colorado, with different rules and conditions, isn’t a precedent from which anyone could derive much in the way of lessons).

The upshot of this is that even when approved, active producers aren’t getting up to full-capacity production very fast.

Conclusion to Parts I-IV

While the numbers presented here are probably closer to wild guesses than educated ones, the general thrust of the story about active legal supply is this:  There is a huge difference between “approved production” and actual production, and this difference can be explained by a number of reasons beyond “government failure.”   Market creation is not a top-down administrative procedure: it’s a social process that implicates complex, locally discernible relations of power and knowledge.

Part V of this series will turn our attention to the notion that I-502 is meant to eliminate the black market right away, and that it is sensible to judge the existing state of legal market capture by whether it is in fact making a dent in illegal cannabis markets.

These notions are wrong, is the preview.  Stay tuned!

Washington State Active Legal Cannabis Landscape Analysis: Part III

Since the publication of this post, we have been alerted that our assumption that most active Tier 3 producers are not indoor may be way off.  Blaine Stum, a researcher with the Spokane Marijuana Policy Working Group, reports that according to his research so far 7 out of the 8 Tier 3’s approved before May 1 may be indoor.  We will adjust our analysis going forward, but keep this in mind for now — Dr. Corva, 7/19/2014

by Dominic Corva, Executive Director

This is the third in CASP’s ongoing analysis of Washington State Active Legal Cannabis supply.  Yesterday, we broke down the pace of approval and started to learn something about the pace of legal cannabis production in the context of an imagined social problem produced by I-502 implementation, the “shortage” that many who should know better are citing as evidence of policy failure.  We will be tackling the “failure” cry as it pertains to I-502 as social, not just cannabis, policy in the coming week.  But for now I want to expand our examination of the I-502 legal cannabis markets as they take shape and how we expect them to change, rather than how they are a failure.

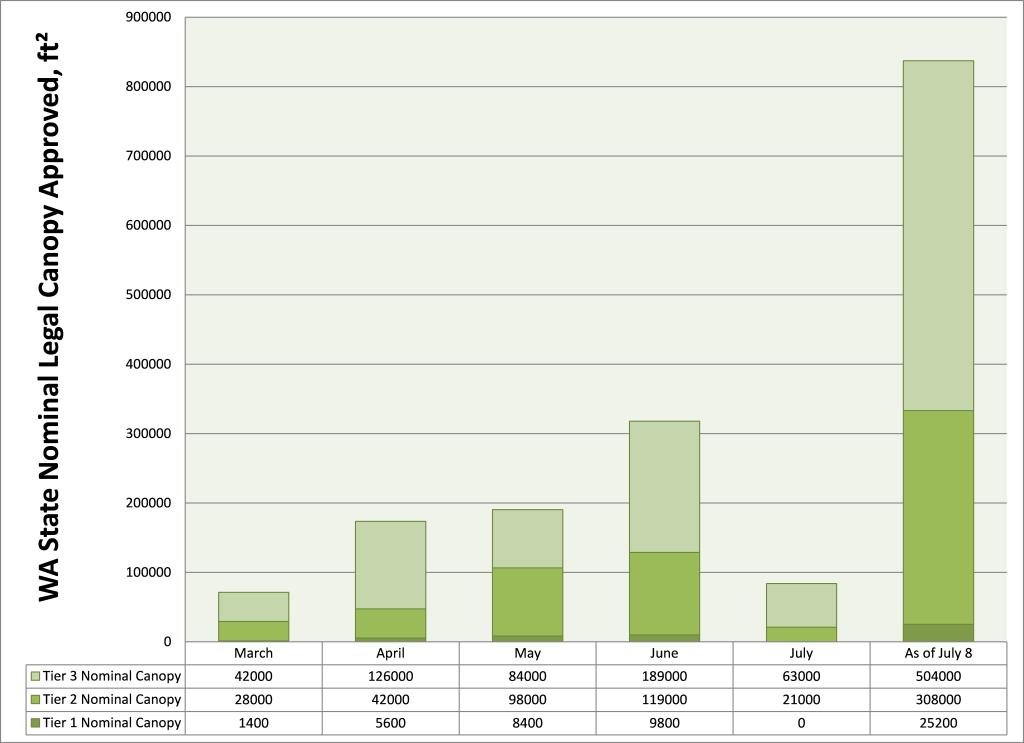
The above chart mirrors yesterday’s simple applicant-denominated narrative but is now broken into (a) Tiers per month and (b) nominal canopy approved per month.  Quite simply, we sorted out the WSLCB’s June 8 data on 87 approved producers by Tier and multiplied by the maximum canopy licensed per Tier: 1400 square feet, 7000 square feet, and 21,000 square feet.

This allows us to mobilize some of the assumptions introduced yesterday in service of how much area can be cultivated rather than how many applicants can cultivate.  Let’s review these, even though they will change with further data and in a different season.

1.  We assume that all Tier 1 cultivation is indoor, and that most Tier 3 cultivation is outdoor since no Tier 3s have been approved in King County (where warehouse production as opposed to greenhouses is most likely) yet.  Both of these assumptions are not likely to hold long, if at all, but they work as rules of thumb.

2.  We assume that all finished production until October, with the exception of smaller light dep rotations, is indoor.  No outdoor cannabis that is not light depped can be harvested until October.

3.  We assume that producers could (have) put most of their garden into bloom upon approval, since they could have had their entire crop in vegetative stasis while they waited.  How many of them were that prepared is an open question.

4.  Therefore we assume that each approved indoor producer could have (had) product available between 6-9 weeks after being approved, given 5-7 weeks of bloom and one for (rushed) curing.  This analysis indicates that while some June-licensed producers could be about ready to get product to market, all producers licensed before May 1 should be able to get product to market absent non-WSLCB factors (jurisdictional moratoria, municipal regulations, bad luck, incompetence, undercapitalization, etc).  Because of our cutoff date, we really only expect 10 Tier 1s, 10 Tier 2s and 8 Tier 3s to be active since these were licensed before May 1 approximately 11 weeks ago.  This allows us to expect the May cohort to approximately double supply by August 1, and the much bigger June cohort to quadruple legal cannabis supply by September 1.

5.  We can also assume that all Tier 3 outdoor and greenhouse canopy is being light-depped to some degree, and therefore some small portion of their approved canopy will produce between in mid July and September.  On the other hand, light-depped plants are smaller and yield less, and non-indoor producers really want to maximize their October harvest.

Tier analysis

168,000 square feet of Tier 3 canopy was licensed before May 1, our cutoff date for expected active canopy.  This canopy can be used in a number of different and hybrid ways:s full-sun, greenhouse, hybrid greenhouse, light dep, and indoor.  Tier 3 light dep canopy projections for mid-July to mid-August (light dep round 1) while 336,000 square feet were approved by July 8, which is a generous cutoff for a second light dep harvest mid-August-mid September.  We will be able to track light dep numbers pretty soon and begin to get an idea of how much Tier 3 canopy was devoted to light-dep, which will allow us to project October harvest numbers.  This is important because one of the first things people should know about non-indoor cannabis agriculture is that most of it is harvested in October, and therefore an increase in supply should lower wholesale prices per pound in November.

Until we have more information on the prevalence and practice of light-dep crops, though, we can’t guess at the ratio of light dep to full-term legal cannabis.  Additionally, Tier 3 canopy licensed after a certain point is not going to have any full term harvest by the end of October and may utilize greenhouse hybridization to bring crops to harvest later and perhaps utilize fully convertible greenhouse design to convert to indoor production in the winter months.  It will be interesting to see how quickly expertise, likely from Israeli cannabis consultants, maximizes year round greenhouse production.  As hybrid greenhouse expertise is developed amongst Tier 3s, legal retail cannabis prices will become competitive with medical and illegal market prices.  That’s a lot of uncertainty, which is why CASP projects a noticeable price drop for November 2014 and black market near-parity by November 2015, depending on how quickly the WSLCB expands its retail pool.

All the variables around Tier 3 production make it very hard to guess at what percentage of that 168,000 square feet of canopy is active, or even capable of maximizing light dep while successfully pulling off a  full term harvest.  Some Tier 3s are probably utilizing indoor infrastructure, as well, to get into the market before then.  Tier 3 production will dominate market share when this stuff gets figured out, but it would be a real stretch to predict much impact before November.

So at the moment, it’s likely that active Tier 3s are using some percentage of their permitted canopy to grow indoor and light dep, which takes a bit longer than indoor but not as much as full term.  Given this, we can make the extremely weak assumption that active Tier 3 producers are currently mobilizing a Tier 1 indoor cycle — both to accelerate time to harvest and to save space for full term outdoor.  So the above chart isn’t much help, but basically 8 Tier 3s were licensed before May 1 so our first rough cut at maximum active Tier 3 canopy is 16,800 square feet at 1400 each.

Tier 2 production is a lot harder to get a handle on: it is likely to be mostly indoor west of the Cascades, and significantly non-indoor east of the Cascades.  We will break down likely Tier 2 indoor/non-indoor splits by this geography later in this series, but for now we will mobilize the assumption that 80% of Tier 2 producers are indoor, and that Tier 2 producers who were licensed before May 1 should be capable of finishing product by now.  So, 70,000 square feet of canopy were licensed to Tier 2 producers by May 1, and 80% of that is 56,000 maximum square feet of Tier 2 canopy.

Indoor Tier 1 production is on the same indoor schedule as Tier 2, and since we assume all Tier 1s are indoor we should have 14,000 square feet of maximum active canopy by now, from 10 Tier 1 producers approved by May 1.

Our extremely provisional calculations thus work out to a maximum of 86,800 square feet of active legal canopy that could have been harvested by now.  That’s a far cry from the approximately 800,000 square feet of canopy figure being cited as approved in the news, and explains a bit better (a) why supply is so limited and (b) the rate at which it can be expected to increase.

How do these number translate into pounds, and can we refine our assumptions to learn more?  Stay tuned for our next installment.


Washington State Active Legal Cannabis Landscape Analysis: Part II


Since the publication of this post, we have been alerted that our assumption that most active Tier 3 producers are not indoor may be way off.  Blaine Stum, a researcher with the Spokane Marijuana Policy Working Group, reports that according to his research so far 7 out of the 8 Tier 3’s approved before May 1 may be indoor.  We will adjust our analysis going forward, but keep this in mind for now — Dr. Corva, 7/19/2014

by Dominic Corva, Executive Director

The Washington State Liquor Control Board released a July 8th update just a week after their last one.  The purpose of this analysis is to inform policymakers and the public about the development of the active legal producer pool in Washington State, and it will be updated regularly.

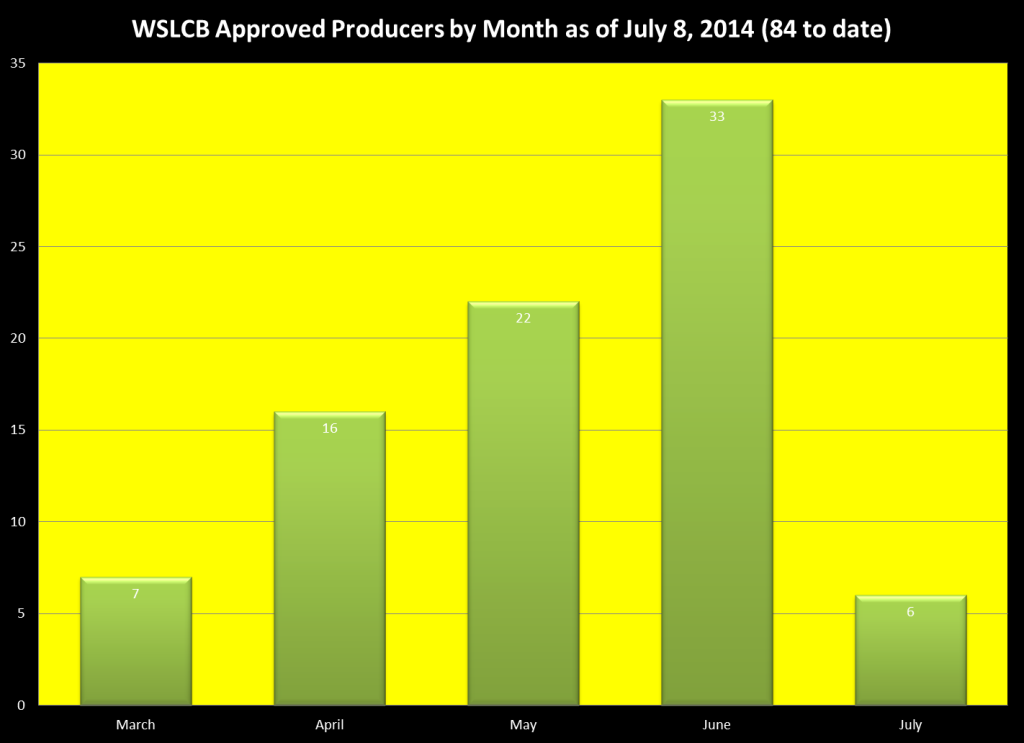
Our first chart, above, tells us a little something about the pace of producer license approvals in Washington State.  That pace is set by many variables, and it is not clear at this time which ones matter the most.  Many assume that this rate is set by the LCB and therefore they are responsible for what is being termed the current “shortage” of legal cannabis in Washington State.  We will address other variables in depth as this post is updated, but for now we can identify a few other variables:  real estate markets and regulation are really important and maybe more so than the pace of the LCB; applicant incompetence is widespread; loss of capitalization as the process drags on; and bad luck should be included as a major variable.

The 84 active state producers counted in the simple chart above do not tell us, however, anything about how much canopy per month has been approved.  CASP will be breaking this down in the coming days.

This chart does tell a simple story, though, from which we will extrapolate.  Remember, indoor producers can grow from cut to flower in about 10 weeks (curing takes longer, but we will ignore that for now).  Producers were allowed to start at any stage of the vegetative cycle, which is about a month indoor but can be indefinite.  Producers who are on the ball have kept their clones in a vegetative state, and in an abstract ideal world the new producers have a significant chunk of their canopy on the cusp of flower when they are approved.  Pending producers, take note and be prepared!

For the sake of our simple story, we will assume that no one activated later than Jun 1 is about to have product to market, since that’s about a month.  In reality, plenty of earlier producers weren’t ready to flower when they were approved, and some producers in June were probably on the ball and about to sell product any day now.

That gives us about 44 active producers who should be capable of supplying the 24 approved retailers who have either opened up this week or soon thereafter.  That’s not a nominal huge number, especially when we take into account that most of these are Tier 1s and Tier 2s.  On the other hand, it means that over the next month the effectively active producers — ones able to process and package cured sinsemilla flowers — will double.  How much a difference this makes will depend on how many more retailers open up; and how many of the 44 pre-Jun 1 producers will finally be coming on line like they should be given their head start.

And that’s really the issue right now.  Approved producers aren’t necessarily active yet, in the final product sense, for all the other variables besides WSLCB approval.  Many of them for some reason or another are missing out on the highest wholesale prices per pound we’ll ever see again.  The first producer to be approved, Kouchlock, had exactly one pound — less, really, at 400 grams — to sell to Cannabis City yesterday.  Nine Point out of Bremerton, WA, which was approved five days after Kouchlock, was able to supply Cannabis City with 10 pounds.  Both undoubtedly have other outlets, but the contrast indicates that perhaps Kouchlock had been running into those other variables we mentioned above — and they affect approved producers, not just pending ones.


My First Day of Legal Cannabis in Washington State


IMG_9008

by Dominic Corva, Executive Director

The first day of legal retail cannabis sales in Washington State started at 330 in the morning for me, though I was asleep.  A last minute interview request from CNN had me getting up early, but apparently first thing in their morning they tried calling me to come to the studio 20 minutes earlier.  By the time I woke, they had changed their mind, so after a desperate search for my own car keys I borrowed Dee’s and headed downtown uncaffeinated.

I struggled to make out where exactly the studio was in Fisher Plaza until Alison Holcomb arrived for her earlier, lengthier live interview (much deserved, of course). James Lathrop and his attorney arrived about the same time the coffee did. While I met James a few months ago, I had no idea he was even in the retail lottery, but once his big grin hit the news I called him up to get some inside scoop. Over the next few days I hooked him up with Sean Green’s active production company, which had a pound available. That increased Cannabis City’s initial supply 10%.

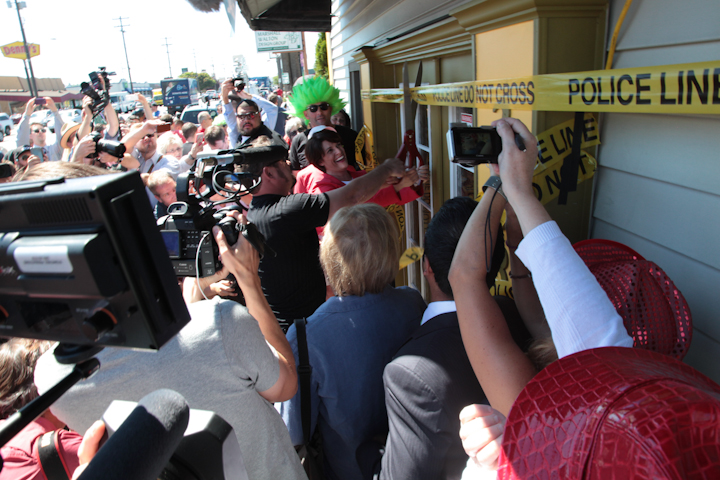
After the CNN “interview” (it was two softball questions and over before I knew it), CASP GIS consultant and videographer Steve Hyde picked me up to check out Cannabis City’s opening act. The space in front of the building was thick with media crews and equipment, VIPs and staff while the line stretched around the block. The entrance to Cannabis City was covered in bright yellow police tape advertising the impossible, today: DO NOT CROSS.


IMG_8927-2


Viv McPeak and Kanti Selig were there, beaming. Hempfest’s Sharon Whitson reminded the crowd that people were still going to prison for marijuana and that we need to not forget about them; Alison H was there, and gave a nice ribbon-cutting speech that reminded everyone that the best reason for doing this was de-incarceration; and Pete Holmes was there, boldly announcing his intention to exercise his freedom and imagining a drug war-free future. Patient advocates held up signs and educated folks about current medical cannabis trials.

IMG_8940


Finally James addressed the crowd with enthusiasm and grabbed some big-ass scissors. The Police Line: Do Not Cross tape met its fate, with some help from Alison Holcomb.

IMG_8915-2


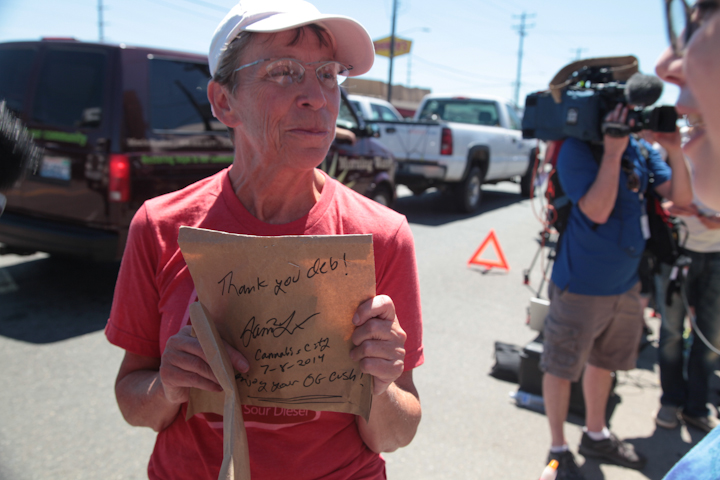
Once the doors were open the real wait began, as one by one people entered to by legal cannabis. A grandmother named Deb walked out first, with each two-gram package in its own paper bag. Deb first consumed cannabis in 1977, and was an occasional enthusiast until her company adopted drug testing policies. Once she retired, one of the first things she did off her “bucket list” was enjoy a joint with friends.  She never went medical, though, and the last time she bought cannabis was six months ago.  Recently, her dealer saw her on the news and rang her to say “So that’s why you haven’t called me!”  She was a little concerned that her conservative daughter might not respond so well to her historic role, so I wished her the best as we ended our chat. The first legal cannabis customer couldn’t have been designed better to change perceptions about cannabis consumers.

IMG_8989


At that point it became a sort of block party — Magical Butter personnel in Seahawks-flourescent-green seemed to be singing, dancing, handing out water and doing line control, music leaking from a soundbox stashed somehere in one of their little MB wagons. Pete Holmes came out with 2 grams and announced to cameras that he was preserving one for posterity, and enjoying the other one in private, himself. Pete, please be more social with your cannabis consumption. I have people who would love to help with that.

IMG_8935


After mingling for a bit, Steve and I went to Lake City to check out the scene at the Amsterdam Exchange Farmer’s Market to catch a snapshot of gray market prices on the day of retail legalization. So here it is:

IMG_9023


I think those prices will be approached in November 2015, when the first full round of Tier 3 outdoor and greenhouse production comes in.