by Dr. Jim MacRae, CASP Research Associate & Dr. Dominic Corva, Executive Director
With the first four months of the I-502 legal cannabis market now behind us, this article presents a summary of the daily sales data provided by the LCB that reveals patterns and trends becoming apparent in those data. We then provide preliminary estimates regarding what sales levels might be over the next 20 months of Washington State’s first Legal Cannabis Biennium (ironically – LCB), and the resulting excise tax revenue to the State.
We begin by making a chart of daily I 502 sales available from the Nov. 18 WSLCB update. This allows us a “jagged” look at the four-month trend, and we are able to identify intra-week patterns and daily variation in the data. We focus next on daily variation, which allows us to see common weekly patterns in the revenue stream. This level of detail reveals recurring tendencies in weekly cycles and date-specific outliers associated with retail spikes and dips. Next, we filter these intra-week spikes out of the data in order to analyze weekly changes and trends over time. This allows us to make some preliminary projections about the development of Washington’s legal cannabis revenues for businesses and the state. It is important to note that as we refine our methods and take into account seasonal variation, these projections will change. However, the following charts allow us a starting point for talking about the evolution of markets and the effectiveness of I 502 as a State revenue policy.
Daily Sales Observation and Analysis
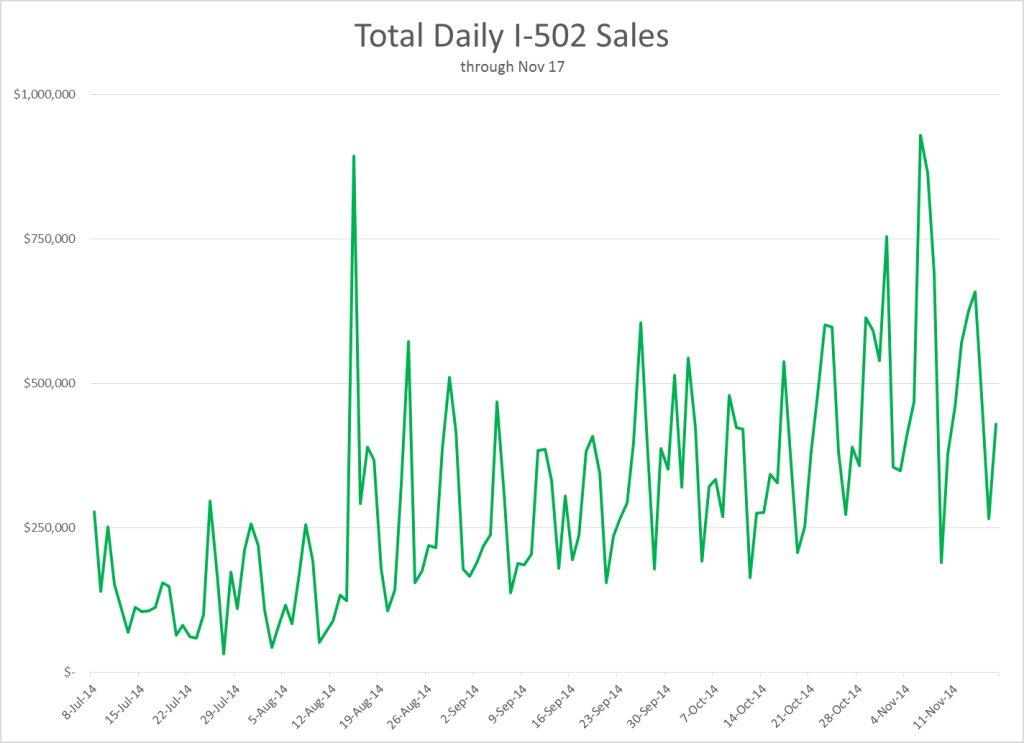
Chart 1 details daily overall levels of I-502 sales (from Producers, Processors & Retailers) spanning the first 19 weeks of the WA recreational cannabis market, as reported by the LCB. These data have been customized to include internal LCB adjustments for sales reported late by I-502 businesses.
Chart 1
While this chart displays an overall trend upward, its dominant feature is one of regular, high – frequency spiking “noise”. Three of the four days in which sales exceeded $750,000 occurred in the first half of November, or the last three weeks. The other spike was during Hempfest/CannaCon in mid-August, and we can predict with some confidence that this will be an annual spike.
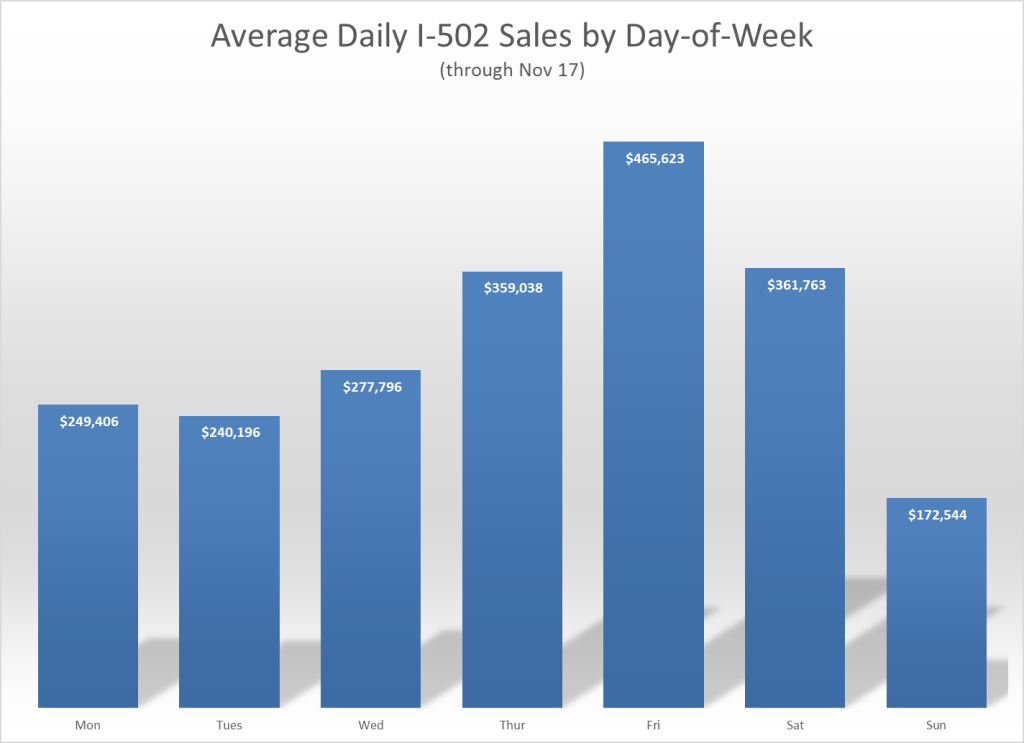
The cyclical noise dominating this trend appears to be driven primarily by the “day-of-week” sales pattern detailed in Chart 2 Sales peak through the weekend before dropping off during the weekday. This suggests that I-502 consumers are indeed consuming “recreationally” in a pattern consistent with the work week, on the one hand, and the presence of tourists closer to the weekend on the other. It would be interesting to compare this weekly variation with alcohol sales, or revenue from other “recreational” consumables.
Chart 2
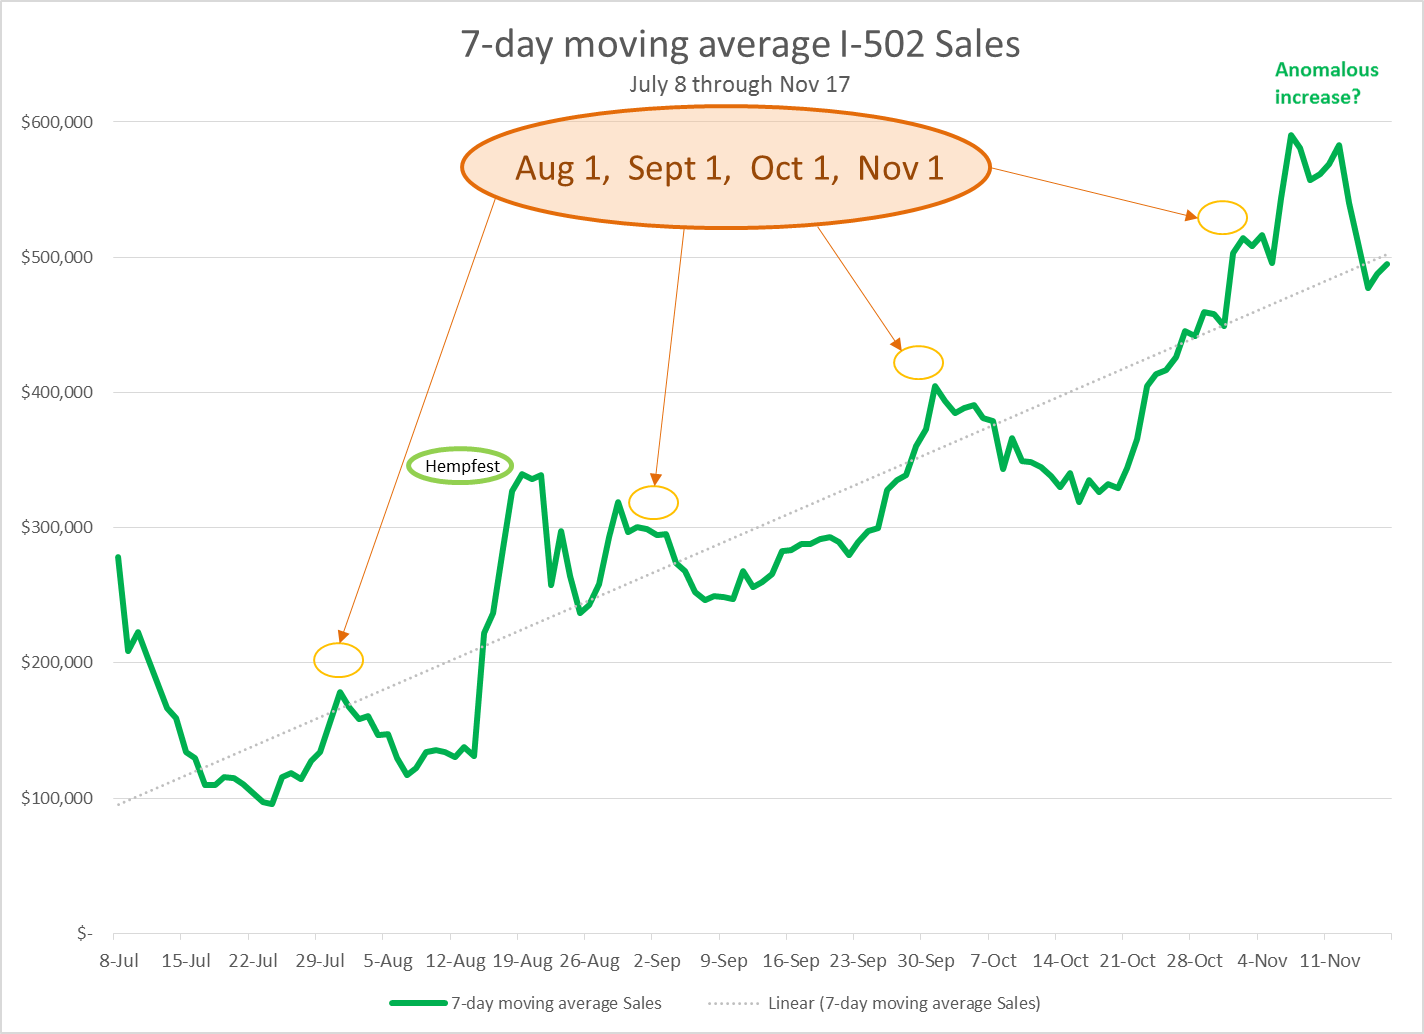
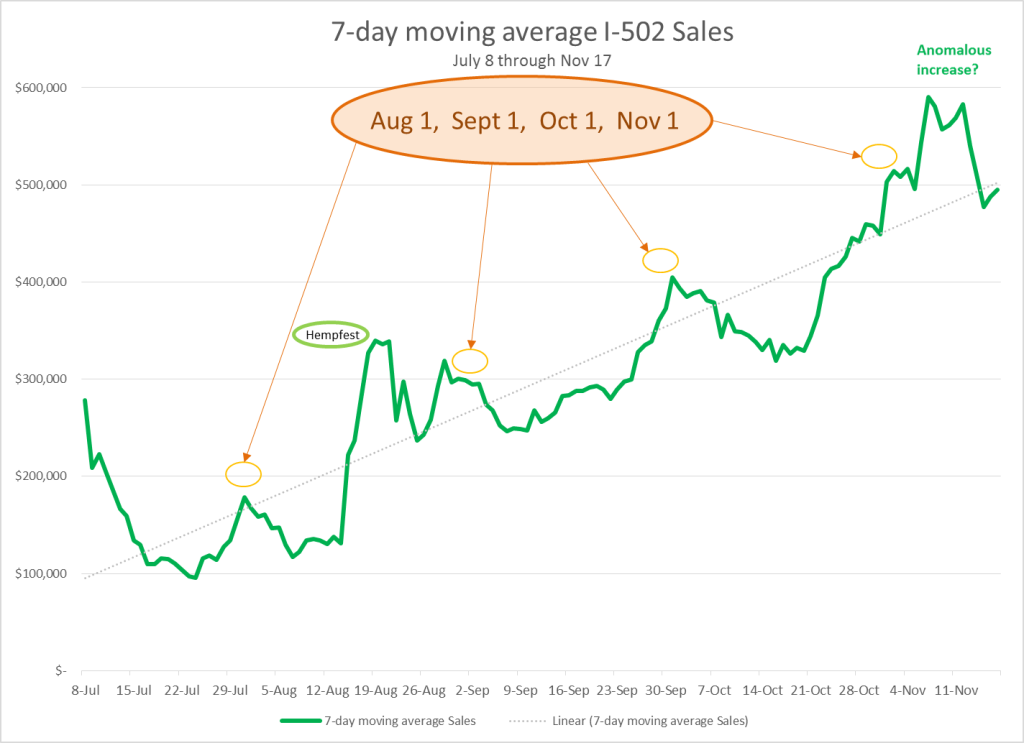
This weekend-preparatory pattern of I-502 Sales led to our decision to display and analyze the daily overall Sales data as a 7-day (trailing) moving average to better understand this market’s week-to-week growth pattern, smoothed out from its jagged daily course. The trend of this moving-average sales metric, along with a few highlighted annotations, follows in Chart 3.
Chart 3
Note: It is expected that the last point or two will always be artificially low because of delays in reporting to the LCB. We think that it’s better-than-even odds that we are seeing the beginning of a trend break upwards. We’ll know in the next few weeks.
With the intra-week noise removed, the relatively consistent growth in sales over the past 3 months is apparent, as is the tendency for small spikes in sales to occur around the beginning of each calendar month, followed by a sharp (and brief) decline. The decline seen following the monthly peaks at the beginning of August, September, and October did not occur in November. It is likely that these peaks correspond to a month-end (or beginning) pay period, which is common to people paid weekly, semi-monthly, and monthly — as well as many people receiving Federal benefits.
The lack of a sharp decline immediately following the initial peak seen November 1 is consistent with a bolus of product entering the pipeline, as expected given the outdoor harvest that occurred last month. In this scenario, increased revenues from production and processing make up for retail sales that usually drive total revenues (since prices are highest at the retail point, with near-zero inventory).
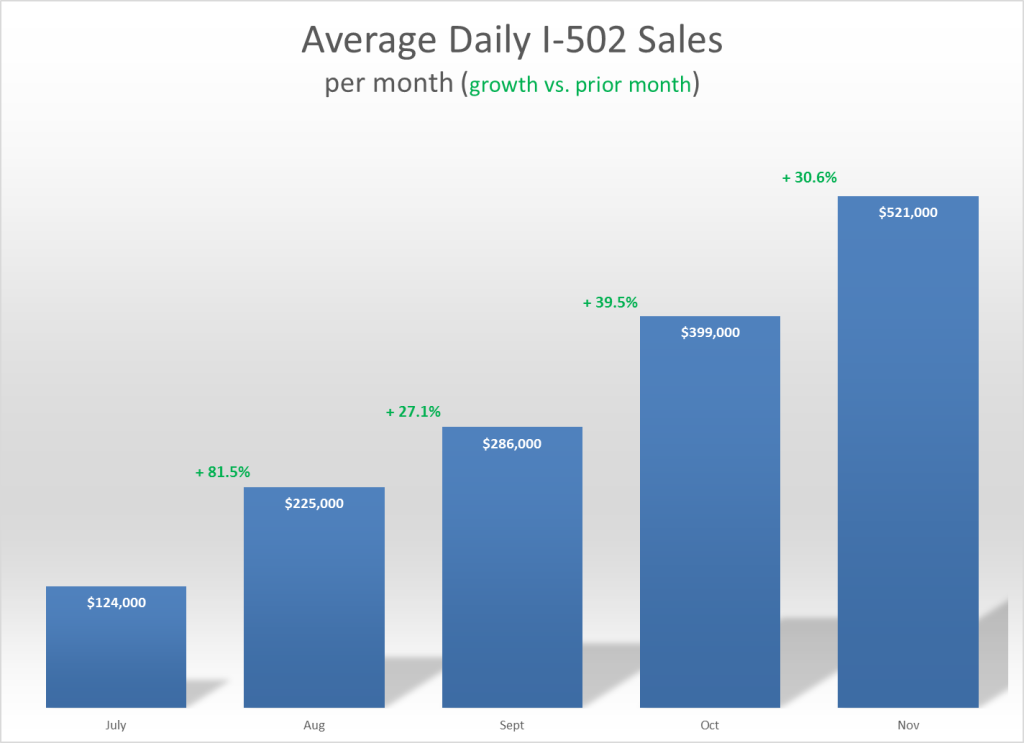
Given the presence of a reasonably consistent monthly cycle revealed after filtering out the intra-week spikes, we felt that it would be useful to look at average daily sales per month and the growth seen in this number from month-to-month. Chart 4 summarizes this information, and allows us to focus directly on how the growth in this market is changing from month-to-month.
Chart 4
This chart reveals a relatively consistent pattern over the past three months, with month-on-month percentage growth averaging in the low 30s. We are using “average daily sales” as the metric and November is only three weeks in, so it will be interesting to see if the autumn harvest pushes this month’s daily average sales upwards over the next week.
We now explore this growth trend using a simple linear forecast that largely ignores the recent upward inflection, and presents preliminary (admittedly weak) estimates of annual sales and excise tax levels over the next 20 months. We also will compare these with tax estimates released this week by the Washington State Economic & Revenue Forecast Council.
The Linear Trend
The simple “best-fit” linear trend is displayed on Chart 3 as a thin grey ascending line. The formula describing this best-fitting straight-line prediction of sales is:
Sales = $92,517 * ($3,077 * day)
This basically says that on day “zero”, Sales started at $92,517 (the intercept) and $3,077 additional dollars are added on each subsequent day (the slope of the line).
This line has an R-squared of .83, meaning that it’s not a bad fit for the smoothed moving average data. If this linear growth were to continue through July 7, 2015 (defining the first full “year” of the I-502 market), we would see sales of $240 million of I-502 sales in this first full year (generating $60 million in excise tax revenue). $65 million of these sales, and $16 million of excise tax are expected in calendar year 2014.
Going forward, and as a very conservative assumption, we opted to run the terminal daily sales level of this forecast (just over $1,200,000 of projected sales on July 7, 2015) and assume that this level of sales “flat-lines” as a constant for each of the next 365 days. This produces, for the second half of Washington’s first cannabis biennium, $444 million in sales and $111 million in excise tax revenue.
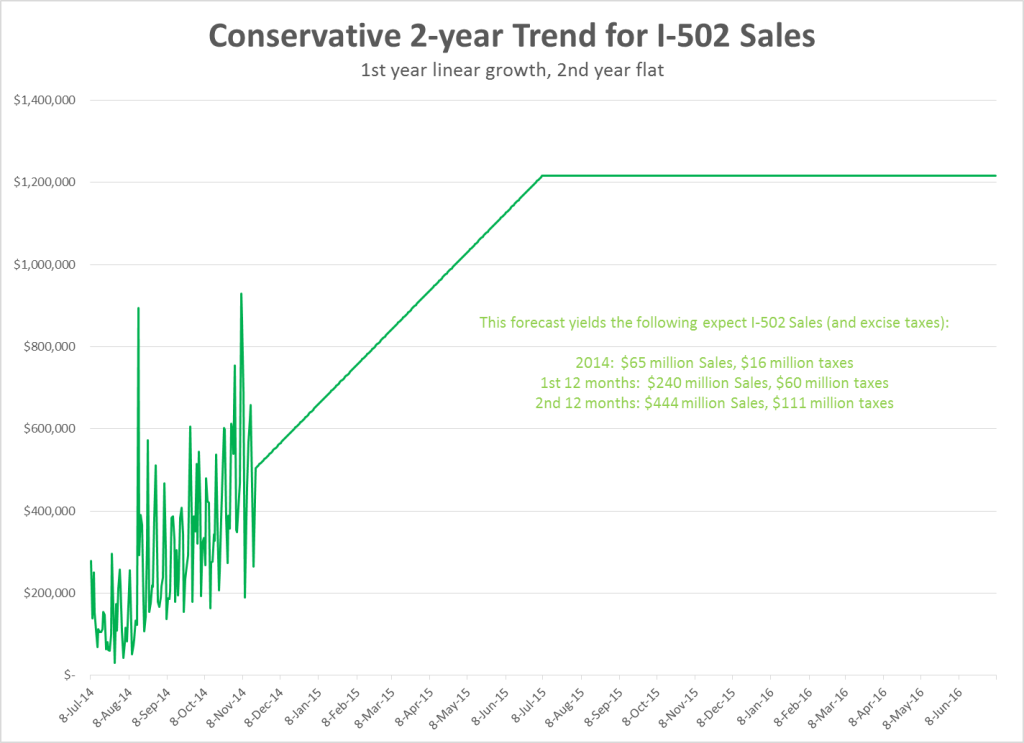
Chart 5
Estimates published this week by the Washington State Economic & Forecasting Council place the total taxes to be collected relating to I-502 at $43 million in the period ending June, 2015. This estimate includes excise tax revenue, sales tax revenue, and B&O tax revenue. In contrast, our simple estimate above suggests that $60 million in excise tax revenue alone will be collected during this time period. This discrepancy may well be the result of the simple linear forecast that we used. Such a model does not take into account annual seasonality in any way, particularly as it is based on such a limited set of actual data (only 4 months’ worth).
Extending this flat-line out an additional year would suggest a total excise tax revenue of $222 million in the biennium ending June, 2017. This, again, seems higher than the official estimate released this week that suggest a total tax revenue during the 2015-2017 biennium of $237 million (with excise, sales, and B&O taxes included). We eagerly await additional data that will allow us more confidence in our estimates.
Implications: What we see, and what we don’t see
Our analysis provides evidence of discernible patterns developing within the evolution of the Washington State Legal Cannabis market, and allows us to demonstrate that even by conservative metrics, business and tax revenues from I-502 show no signs of faltering in the coming year.
There is no indication in this particular analysis that the initial surge of growth seen over the first 4 months of our legal cannabis market is going to slow down any time soon. However, we have yet to introduce our first evolutionary market challenge: what is known in cannabis black markets as the “dry season,” when outdoor cannabis agriculture goes dormant for the winter. In a forthcoming post, we will look into how we think this will play out in our much more limited legal production market. For now, however, we are sure that at least a third of approved Tier 3s just had their last harvest till July 2015. How that affects the market depends on how much those businesses decide to keep as inventory and dole out over time, to get the best wholesale prices, and how many of those businesses simply pushed all of their product into the system.
We also note, with caveats, that fewer than 25% of the allocated retail stores are licensed let alone open for business, and fewer than 15% of production and/or processing licenses have been granted. This would seem to suggest that this level of growth will continue for at least the next year or two, as those approval rates fill in. However, we understand that many of the pending applications for production and processing are not viable, and that we are probably much further along the production possibility curve than these numbers suggest.
