by Dominic Corva, Executive Director
On July 1, 2014, the Liquor Control Board updated their master applicant for producers and processors. This post is our first analysis of legal landscape production in Washington State.
62 Producers licenses are listed as “Active,” out of 2654 total. Of that total, another 13 license applications have been withdrawn. This translates into about 2% of the applicant pool that is currently producing cannabis for retail shops that open early next week.
This seems like a pretty low number after more than six months, and some of that can be attributed to WSLCB’s chronic under staffing issues. Several other things should be in the readers’ minds for context. First, a significant number of producer applicants came from folks who were in weak position to capitalize on a license should they get it, whether from inexperience, incompetence, regulatory curveballs, under capitalization, and plain old bad luck. This was evident from my interview with I-5 Realty owner Tom Gordon, who estimated that between 5-15% of total applicants would be active when the one year anniversary of the process occurs in November, due to their own issues. It also jibes with WSLCB staffer Becky Smith told me two months ago, that much of the hold-up was due to applicant issues rather than the agency’s human capital restraints.
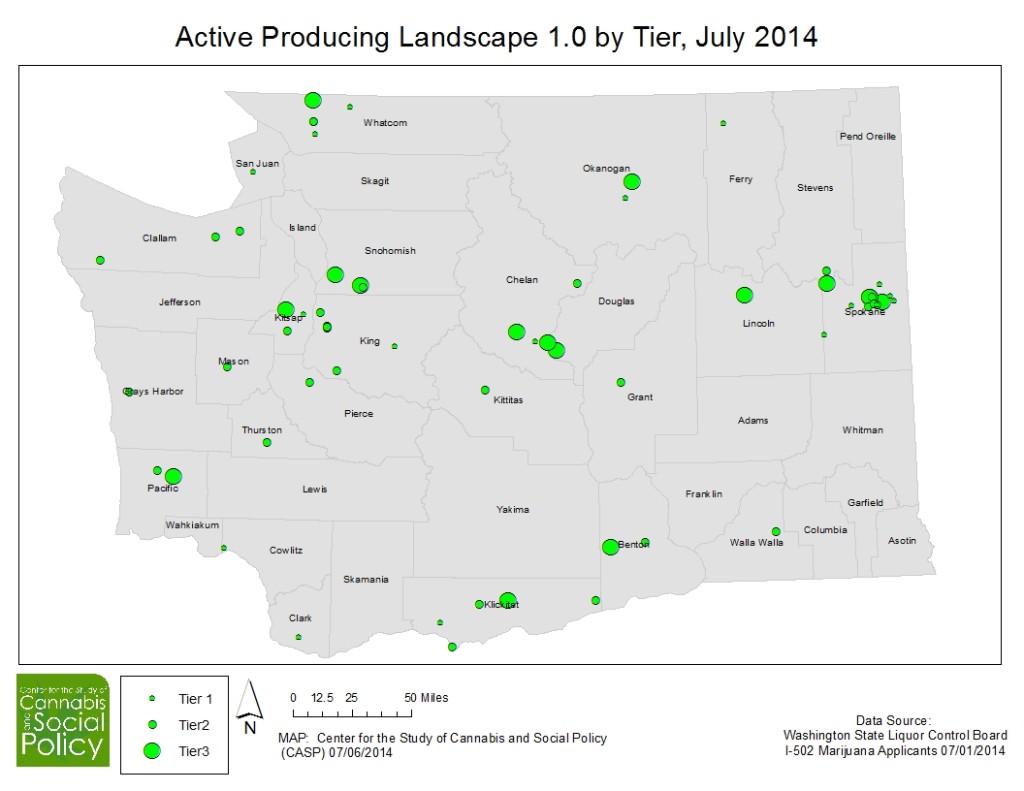
Nonetheless, it is significant enough for the Center for the Study of Cannabis and Social Policy to begin mapping the landscape. This begins with a basic step, the mapping of all 62 locations. While we used publicly available WSLCB data on applicant addresses, we have chosen not to list those out of concern for processor safety. The overall picture reveals that 548,800 square feet of canopy are “active” across the state. Remember, this time last year the WSLCB expected to license 2 million square feet of canopy for I-502, total. We are now a quarter of the way to that destination, and while that guideline has been bent and now broken, it’s something to keep in mind when people speculate about legal cannabis “shortages” and for how long.
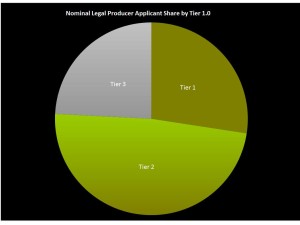
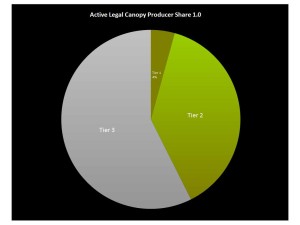
The next thing to discern from the data are how big each processor is, by Tier, because this makes a huge difference between nominal market share and actual market share. Tier 1 producers constitute 27% of approved licenses, Tier 2 48%, and Tier 3 24%. By share of maximum nominal canopy licensed, however, the maximum square footage for Tier 1 producers is 5%; Tier 2 38%; and Tier 3 a whopping 57%. These are nominal canopy numbers because effective canopy licensed depends strongly on whether folks are growing indoor or not indoor: indoor producers can max out at 5 canopy cycles per year while full sun outdoor producers can get 3 — and two of those are light dep cycles.
Once we have the Tier breakdown, we can estimate (a) total approved effective canopy production and (b) market share per Tier Operation. This gives us a sense of projected Tier market shares, since we have a 62 sample data set. As a rule of thumb, all Tier 1 licenses can be assumed to be indoor production while all currently approved Tier 3 licenses can be assumed to be not indoor, because no Tier 3s have been licensed in King County, where large warehouse production is most likely. At the same time, outdoor Tier 3 production does not have the capacity to rush growth on order to get to market like indoor canopy does. Most Tier 3s are probably doing light deps for early harvests, but the lion’s share of their production will be harvested in October. So, 57% percent of currently active canopy is highly unlikely to produce their maximum canopy till October, which skews the actual, existing production in favor of indoor, smaller producers and outdoor Tier 3s with hybrid greenhouses.
All signs point towards major windfalls for this cohort of active legal producers. I’ve received reports of bids for wholesale pounds that range from $3000/lb to $7000/lb, which is about where black market prices were in the late 1980s till mid -2000s. The $7000 bid is probably anomalous and would represent the highest price I’ve ever heard someone willing to pay for a pound of wholesale flower. Most of the wholesale pound range will probably by between $4000-5000/lb, although folks with producer processor licenses will be able to capture more of that windfall than those with just producer licences given the extra tax step — but those producer/processors now have to contend with selling those pounds in packaged increments: one gram, two grams, and eighth (about 3.5 grams) and a quarter ounce. That’s a lot of extra work and they are probably paying people to do it.
How does that work out per gram, if retailers sell pre-tax at between $15-$25/gram? The $4000-$5000/lb wholesale works out to $9 and $11/gram that the producer gets — add $2.50 for the retail excise tax margin and current estimates then work out to a margin of between $2.50-$12.5/gram for retailers*. The low end is not much, and perhaps there are more wholesale pounds going at under $4000/lb than I am aware. It will be interesting to see whether the legal market follows the illegal and medical tendency for each step in the chain to add about 20%, but that’s about what it shapes up to be with these calculations.
This has been our first analysis of active legal cannabis production landscapes in Washington State. We will be updating these each time the WSLCB releases new data.
*This calculation has been revised and clarified. Special thanks to CASP ally and accounting consultant, Todd Arkley CPA.


One thought to “Washington State Active Legal Cannabis Landscape Analysis: Part I”
Comments are closed.