Crucial moment for cannabis and social policy in Washington State

Act here.  Read on for clarification.

Dear Washingtonians,

US Attorneys are critical interfaces between state and federal policy, especially when these do not line up.  They determine, more than any other branch of government, how to manage contradictory federal/state legal fields through policy.  Durkan’s record was incredibly favorable towards state experimentation.  Her successor may not share her wisdom.

We can do something about it.

Since US Attorneys are nominated by state senators, usually in response to someone’s interest in putting their person in this critical position, we cannot influence this by voting.  Instead, we need to influence this by organizing, and the best way to do that is to write letters to the senators that nominate them. This effort by ASA, the political wing of our fiscal sponsor ASAF, makes it much easier for everyone to write a letter and send to Senators Murray and Cantwell.

So, take 5 minutes.  Fill in the blanks, print, put in an envelope, and send to the provided address.  Share it with your friends, play telephone with it.  This may be the most important thing you can do right now if you are interested in optimizing cannabis and social policy.

The link is here, and at the top of this post.

From the link:

“U.S. Attorney for Western Washington Jenny Durkan resigned recently and our U.S. Senators are now considering who to recommend as her replacement. It is very important that Senators Murray and Cantwell recommend a replacement who has at least as much respect for the state medical cannabis program as former U.S. Attorney Durkan. Please take a moment to fill out the following letter to both Senators Murray and Cantwell to make sure they recommend a U.S. Attorney who will help preserve the rights of medical cannabis patients in Washington State. – See more at: http://org.salsalabs.com/o/182/p/dia/action3/common/public/?action_KEY=16513#sthash.qrNHPMcX.dpuf

Washington’s Legal Production Landscape Update 9.30.2014

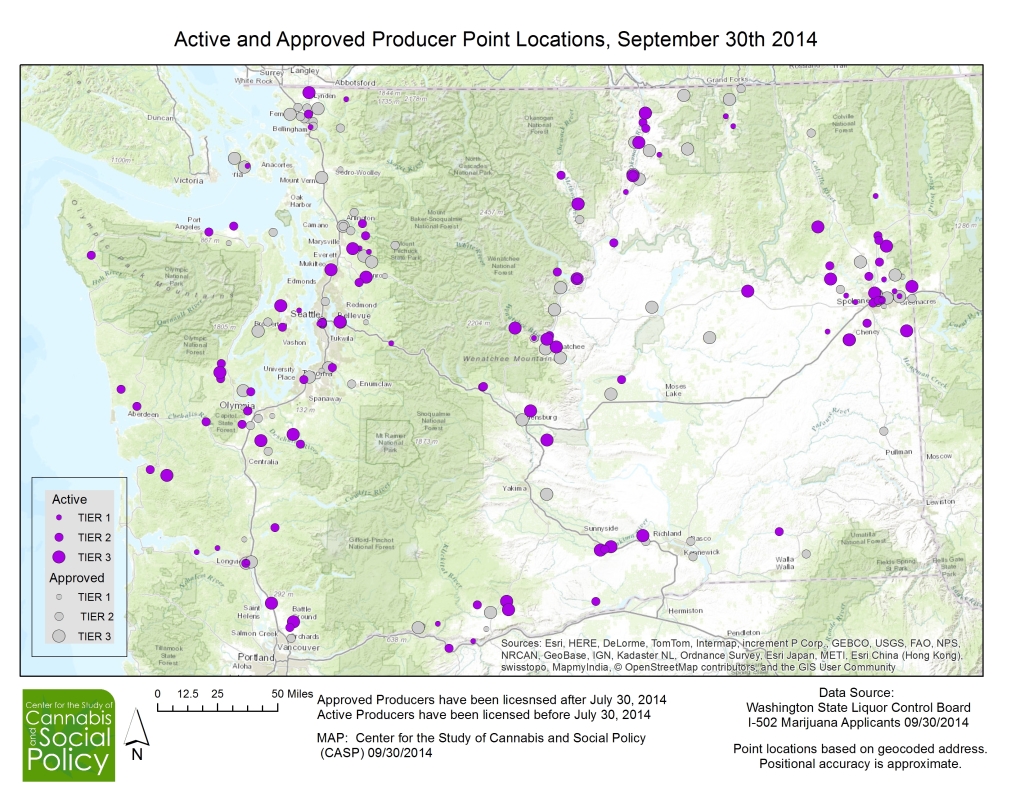
09302014_MAP

Map by Steve Hyde

by Dominic Corva, Executive Director

*This late September update uses the 9/30 Washington State Liquor Control Board list of “Marijuana License Applicants,” available here.

The purpose of this post is to extrapolate from the most current data in order to map the legal cannabis production landscape and identify the scope and rate of active production for the I-502 market.  The map above shows you how the landscape is filling in by Tier, and differentiates “Active” from “Approved” producers by allowing for a 10 week lag between approval and approximate expected production.  The 10 weeks are a “rule of thumb” estimation rather than derived from any particular assessment for each producer.  All producers approved by July 21, 2014, are therefore considered active for this update.  We’ll start with a table that shows our estimation of Active max square feet of canopy by Tier, next to pending production, approved less than 10 weeks ago, next to the total Approved.  Given that the outdoor and greenhouse harvest season is upon us, we cannot with confidence project all currently approved producers as active in the next ten weeks, because many of them simply won’t be able to begin significant harvest cycles.


Producer Tier Active 9/30 Approved not Active yet Total Approved
Tier 1 36400 30800 67200
Tier 2 385000 315000 700000
Tier 3 777000 1029000 1806000
All Tiers 1198400 1374800 2573200


The WSLCB has approved about 2.5 million sq feet of canopy, but only about 1.2 million sq ft of canopy should be considered “active” in the sense that they are producing harvests at regular intervals.

We have been inquiring into canopy usage over the last month, in order to refine our projections further.  We found that outdoor producers were using about 95% of their max canopy, while indoor producers were using about 30% of their canopy for flowering.  This reflects the fact that a lot of canopy must be dedicated to the propagation and vegetative cycles, but also that many producers are “bootstrapping” their resources on their way to maximized efficiency. We therefore have enough information for this update to refine our data so that it reflects not only “Active” canopy, but “Effective” canopy.”  In order to do this, however, we needed to estimate the canopy breakdown by grow type — indoor, outdoor, and both; and estimate those by Tier.

The WSLCB provided us with a sample breakdown these three categories of grow types by Tier for 150 approved producers — not everyone on the list, but most.  This is a robust enough sample to predict with confidence the ratio of indoor, outdoor, and “both” for the active producer data set, by multiplying the ratio of each grow type by total Tier canopy.

WSLCB sample Indoor Outdoor Both Total
Tier 1 25 3 2 30
Tier 2 45 12 19 76
Tier 3 13 20 21 54


This sample gave us a percentage of Indoor, Outdoor, and Both for each Tier:

WSLCB coefficients Indoor Outdoor Both
Tier 1 0.83 0.10 0.07
Tier 2 0.59 0.16 0.25
Tier 3 0.24 0.37 0.39


Then we multiply these coefficients to multiply by our 9/30 breakdown of active producers by tier to get nominal sq feet of canopy by grow type:

Approved Nominal Canopy Indoor Outdoor Both
Tier 1 30333 3640 2427
Tier 2 227961 60789 96250
Tier 3 187056 287778 302167


Then we multiply each box by our assumptions about Effective canopy according to the average of what our interviewees told us about the percentage of their canopy they were actually using: 95% for outdoor, 30% for indoor; and we split the difference for “both” to give us 65%.  This is a very crude methodology, in no small part because “Both” is vaguely defined while actual combination practices may vary substantially.

Effective Canopy Indoor Outdoor Both
Tier 1 9100 3458 1517
Tier 2 142475 57750 60156
Tier 3 116910 179861 188854
Total 9/30 268485 241069 250527


Effective Canopy Sq Ft Market Share by Tier 9.30.2014

This methodology not only allows us to estimate effective canopy per Tier by Grow.  It also gives us a new aggregate canopy estimation, different from both Approved and Active, of 760,081 sq ft.  

Producer Tier Active Effective
Tier 1 36,400 14,075
Tier 2 385,000 260,382
Tier 3 777,000 485,625
Total 1,198,400 760,081


Effective Canopy is less than Active canopy, and this chart provides a way to compare.
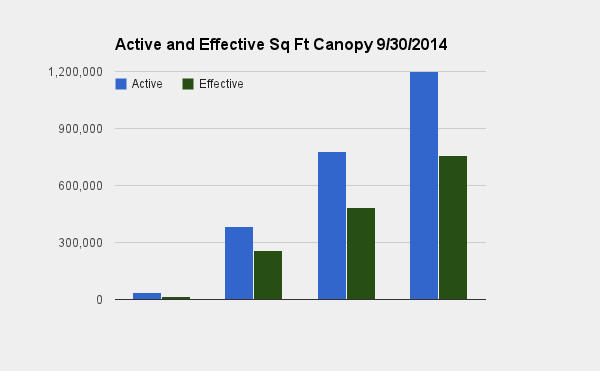
Active Sq Ft Canopy 9.30.2014

We can also project what that canopy means in terms of lbs, using the WSLCB estimate of one lb of flower and one lb of trim per 25 sq ft.  These numbers are nominal pending information from the WSLCB on percentage of crop failed microbial and other testing.  My understanding is that this is a significant number,and we will update that when we hear back from the WSLCB.

Current Cycle Yield Effective Canopy sq ft Lbs flower (nominal) Lbs Trim (nominal)
Indoor 14,075 563 563
Both 260,382 10,415 10,415
Outdoor 485,625 19,425 19,425
Total 760,081 30,403 30,403


Growtype market share 9.30.2014


Concluding thoughts

1.  The WSLCB is entertaining options for increasing canopy allotted to already approved processors.  Speeding up the approval rate seems not to be an option, for pragmatic reasons.  First, producer approval is no guarantee of producer viability:  applicants have to deal with many other factors.  One that has become clear recently is a trend in counties that are otherwise 502-friendly to zone out rural residential production.  We have been hearing a lot about this from producers on the Olympic Peninsula, and it means that many folks who are approved suddenly don’t have county permission to proceed.  We are also hearing about new moratoriums under consideration in for example Snohomish County, where NIMBYism seems to be activating resistance to individual 502 production.  In all cases, approved 502 producers are rallying together to deal with common problems that simply can’t be dealt with at the state level and for which the WSLCB has no influence.

2. If canopy allotments change back to the original 2000/10000/30000 sq ft max, there is no need to panic if you have not been approved yet.  There’s plenty more canopy that the state needs in order to overgrow informal cannabis markets.  Many producers are not aware that the WSLCB consigned the original 2 million sq ft to the dustbin as a necessary originating fiction.  A month ago, Randy Simmons opined that they have a vague ceiling range in their head now of around 8-10 million square feet, and other WSLCB officials have been quoted at 12 million sq ft.  These numbers are fungible, and there are a TON of retail stores yet to open.  Operating with about the same degree of confidence as Simmons seemed to be indicating from his seat next to me at an MJBA “Business Intelligence” panel, I wouldn’t be surprised to see approved canopy hit 20 million before it becomes a concern.  Again: the strategy for getting legal prices down is to approve as much canopy as they can and overgrow informal cannabis markets.

3. Until this point I have focused on the trajectory of canopy approval as though it will increase incrementally, while the October harvest will bring prices down a bit.  It’s time to put those two observations together.  Outdoor growers will harvest in October, with product availability increasing in November.  But if outdoor growers find it necessary to recapitalize by selling off inventory, that supply ease will be very short lived and we may resume an upward price trajectory through spring 2015.

4. As we gather data from active producers these estimations will be refined.  Right now we don’t know how many cycles folks that were approved early have gone through; and how many cycles will dead-end in October.  As it has been since the 1990s, indoor harvests will take us through the winter, spring, and early summer until light dep and hybrid greenhouses really get going.  If you are a smaller producer, that will be a window to take advantage of until the Tier 3 outdoor price rudders turn.  Don’t panic; get fair wholesale prices; and organize so you don’t get swallowed whole by increasingly industrial cannabis agriculture — which is going to have more financial shark money as we go along, not less.


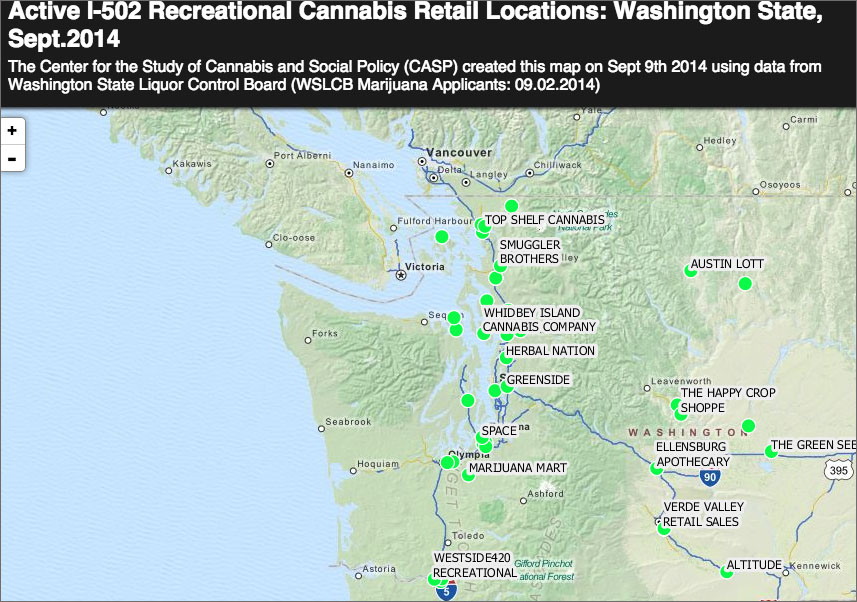
[Interactive MAP] Active Recreational Marijuana Retail Locations, WA. September 16th, 2014

CLICK ON THE MAP IMAGE BELOW TO ACCESS INTERACTIVE MAP

http://mgo.ms/s/tlglt

Map by Steve Hyde

Research by Danny Hackin and Dominic Corva

Tradename StreetAddress City County DayPhone Hours of Operation
2020 SOLUTIONS 2018 IRON ST STE A BELLINGHAM WHATCOM 3603938697 M-F 9-9, Sa 9-7, Su 11-6
420 CARPENTER 422 CARPENTER RD STE 105 LACEY THURSTON 3604026368 Su-Sa 11-8
4US RETAIL 23251 HWY 20 OKANOGAN OKANOGAN 3602240978 M-Sa 10-7
ALTITUDE 260 MERLOT DR PROSSER BENTON 5097864200 M-Th 2:30-6:30, F 1-8, Sa 11-7, Su 1-5
AUSTIN LOTT 29 HORIZON FLATS RD STE 8 WINTHROP OKANOGAN 5094295556 M-Su 10-6
BUD HUT 1123 E STATE ROUTE 532 CAMANO ISLAND ISLAND 3606293480 Su-Sa 10-10
CANNABIS CITY 2733 4TH AVE S 1st Floor Unit SEATTLE KING 2066821332 M-Su 12-8
CASCADE KROPZ 19129 SMOKEY POINT BLVD STE B ARLINGTON SNOHOMISH 3606595422 M-Sa 10-8
CREATIVE RETAIL MANAGEMENT 7046 PACIFIC AVE TACOMA PIERCE 2536917293 M-Su 10-10
FREEDOM MARKET 820A WESTSIDE HWY KELSO COWLITZ 3603550682 M-Su 9-12pm
GREEN STAR CANNABIS 1403 N DIVISION ST STE A SPOKANE SPOKANE 5099193398 M-Th 10-10, F-Sat 10-12, Su 10-6
GREEN THEORY 10697 MAIN ST STE B BELLEVUE KING 4255027033 9/1/2014
MAIN STREET MARIJUANA 2314 MAIN ST VANCOUVER CLARK 4259745804 M-Th 11-7, F-Sa 11-8, Su 11-6
MARGIE’S POT SHOP 405 E STUEBEN BINGEN KLICKITAT 5094930441 Su-Sa 10-7
NEW VANSTERDAM 6515 E MILL PLAIN BLVD VANCOUVER CLARK 3605974739 Su-Th 11-9, F-Sa 11-10
SATORI 9301 N DIVISION ST STE B-C SPOKANE SPOKANE 5099947051 Su-Th 11-7, F-Sa 11-9
SPACE 3111 S PINE ST TACOMA PIERCE 2066508908 M-Su 10-10
SPOKANE GREEN LEAF 9107 N COUNTRY HOMES BLVD STEB SPOKANE SPOKANE 5099193467 M-Sa 10-8:30, Su 10-7
THE HAPPY CROP SHOPPE 50 ROCK ISLAND RD EAST WENATCHEE DOUGLAS 5098881597 M-Th 12-7, F-Sa 12-8
TOP SHELF CANNABIS 3863 HANNEGAN RD BELLINGHAM WHATCOM 3602243735 M-Th 10-8, F-Sa 10-10
VERDE VALLEY RETAIL SALES 4007 MAIN ST UNION GAP YAKIMA 5094203430 M-Su 10-10
WESTSIDE420 RECREATIONAL 4503 OCEAN BEACH HWY STE 103 LONGVIEW COWLITZ 3604235261 Th-Su 10-8
WHIDBEY ISLAND CANNABIS COMPANY 5826 S KRAMER RD STE A AND D LANGLEY ISLAND 3603216151 M-Su 10-10
GREENSIDE 10600 MAIN ST BELLEVUE KING 2069103811 M-F 10-9, Sa-Su 10-7
MILL CREEK NATURAL FOODS 4315 MAIN ST STE A UNION GAP YAKIMA 5098400186 M-Sa 12-5
HERBAL NATION 19302 BOTHELL EVERETT HWY BOTHELL SNOHOMISH 4254852535 M-Th 10-10, F-Sa 10-12pm, Su 10-6
SEA CHANGE CANNABIS 282332 HIGHWAY 101 STE 2 PORT TOWNSEND JEFFERSON 2064228328 M-Su 10-8
CROCKPOT 1703 SE SEDGWICK RD STE 113 PORT ORCHARD KITSAP 2533127280 Tu-Su 9-9
CASCADE HERB COMPANY 1240 E MAPLE ST STE 103 BELLINGHAM WHATCOM 9082856086 M-Su 9-8
420 HOLIDAY 2028 10TH AVE LONGVIEW COWLITZ 5093030681 9/1/2014
ELLENSBURG APOTHECARY 1516 WEST UNIVERSITY WAY ELLENSBURG KITTITAS 5098335556 M-Sa 10-6
GREEN COLLAR 10422 PACIFIC AVE S STE B TACOMA PIERCE 2532670675 M-Su 10-10
CLEAR CHOICE CANNABIS 8001 S HOSMER ST TACOMA PIERCE 2534445444 M-Sa 10-7, Su 12-6
GREEN STOP 7466 MT BAKER HWY MAPLE FALLS WHATCOM 3603937702 Not Yet
HERBAL ACCESS RETAIL 661 NESS’ CORNER RD PORT HADLOCK JEFFERSON 3602977996 Not Yet
221 18729 FIR ISLAND RD STE C MOUNT VERNON SKAGIT 3604454221 M-Sa 10-8, Su 10-6
GREEN LADY 3044 PACIFIC AVE SE STE B OLYMPIA THURSTON 5098697574 M-Sa 10-8, Su 11-7
MARIJUANA MART 1405 YELM AVE E YELM THURSTON 3604801912 October
SAVAGE THC 4428 WILLIAMS VALLEY RD STE A CLAYTON STEVENS 5099992989 Tu-Su 12-8
GREEN LEAF 4220 MERIDIAN ST STE 102 BELLINGHAM WHATCOM 3603032860 M-Su 9-9
TOKEN HERB 837 A CRESCENT BEACH RD EASTSOUND SAN JUAN 3603766900 Not Yet
HIGH SOCIETY 1824 BROADWAY EVERETT SNOHOMISH 2063071651 9/15/14 (Hopefully)
LOVING FARMS 2615 OLD HIGHWAY 99 S MOUNT VERNON SKAGIT 3605405168 October
SMUGGLER BROTHERS 1912 STATE ROUTE 20 SEDRO WOOLLEY SKAGIT 3606473437 Late September/Mid October
CANNARAIL STATION 1448 BASIN ST NW SUITE A EPHRATA GRANT 5097541047 Su-Sa 10-10
SPOKANE’S GREEN DEPOT 71 N RALPH ST STE 102 SPOKANE SPOKANE 2532417773 Not Yet
CANNABLYSS 2705 HARTFORD DR STE A LAKE STEVENS SNOHOMISH 4253277529 Not Yet
SATIVA SISTERS 10525 E TRENT AVE STE 1 SPOKANE SPOKANE 2086603909 M-Su 12-9
I-502 CANNABIS STORE 3012 GS CENTER RD STE A WENATCHEE CHELAN 2817260614 Not Yet
THE GREEN SEED 8420 ASPI BLVD STE 3 MOSES LAKE GRANT 5098552271 Not Yet


Washington State Retail: Who’s Open, When, and Where 8/29/2014

Research by Danny Hackin and Dominic Corva

Tradename StreetAddress City County DayPhone Hours of Operation
2020 SOLUTIONS 2018 IRON ST STE A BELLINGHAM WHATCOM 3603938697 M-F 9-9, Sa 9-7, Su 11-6
420 CARPENTER 422 CARPENTER RD STE 105 LACEY THURSTON 3604026368 Su-Sa 11-8
4US RETAIL 23251 HWY 20 OKANOGAN OKANOGAN 3602240978 M-Sa 10-7
ALTITUDE 260 MERLOT DR PROSSER BENTON 5097864200 M-Th 2:30-6:30, F 1-8, Sa 11-7, Su 1-5
AUSTIN LOTT 29 HORIZON FLATS RD STE 8 WINTHROP OKANOGAN 5094295556 M-Su 10-6
BUD HUT 1123 E STATE ROUTE 532 CAMANO ISLAND ISLAND 3606293480 Su-Sa 10-10
CANNABIS CITY 2733 4TH AVE S 1st Floor Unit SEATTLE KING 2066821332 M-Su 12-8
CASCADE KROPZ 19129 SMOKEY POINT BLVD STE B ARLINGTON SNOHOMISH 3606595422 M-Sa 10-8
CREATIVE RETAIL MANAGEMENT 7046 PACIFIC AVE TACOMA PIERCE 2536917293 M-Su 10-10
FREEDOM MARKET 820A WESTSIDE HWY KELSO COWLITZ 3603550682 M-Su 9-12pm
GREEN STAR CANNABIS 1403 N DIVISION ST STE A SPOKANE SPOKANE 5099193398 M-Th 10-10, F-Sat 10-12, Su 10-6
GREEN THEORY 10697 MAIN ST STE B BELLEVUE KING 4255027033 9/1/2014
MAIN STREET MARIJUANA 2314 MAIN ST VANCOUVER CLARK 4259745804 M-Th 11-7, F-Sa 11-8, Su 11-6
MARGIE’S POT SHOP 405 E STUEBEN BINGEN KLICKITAT 5094930441 Su-Sa 10-7
NEW VANSTERDAM 6515 E MILL PLAIN BLVD VANCOUVER CLARK 3605974739 Su-Th 11-9, F-Sa 11-10
SATORI 9301 N DIVISION ST STE B-C SPOKANE SPOKANE 5099947051 Su-Th 11-7, F-Sa 11-9
SPACE 3111 S PINE ST TACOMA PIERCE 2066508908 M-Su 10-10
SPOKANE GREEN LEAF 9107 N COUNTRY HOMES BLVD STEB SPOKANE SPOKANE 5099193467 M-Sa 10-8:30, Su 10-7
THE HAPPY CROP SHOPPE 50 ROCK ISLAND RD EAST WENATCHEE DOUGLAS 5098881597 M-Th 12-7, F-Sa 12-8
TOP SHELF CANNABIS 3863 HANNEGAN RD BELLINGHAM WHATCOM 3602243735 M-Th 10-8, F-Sa 10-10
VERDE VALLEY RETAIL SALES 4007 MAIN ST UNION GAP YAKIMA 5094203430 M-Su 10-10
WESTSIDE420 RECREATIONAL 4503 OCEAN BEACH HWY STE 103 LONGVIEW COWLITZ 3604235261 Th-Su 10-8
WHIDBEY ISLAND CANNABIS COMPANY 5826 S KRAMER RD STE A AND D LANGLEY ISLAND 3603216151 M-Su 10-10
GREENSIDE 10600 MAIN ST BELLEVUE KING 2069103811 M-F 10-9, Sa-Su 10-7
MILL CREEK NATURAL FOODS 4315 MAIN ST STE A UNION GAP YAKIMA 5098400186 M-Sa 12-5
HERBAL NATION 19302 BOTHELL EVERETT HWY BOTHELL SNOHOMISH 4254852535 M-Th 10-10, F-Sa 10-12pm, Su 10-6
SEA CHANGE CANNABIS 282332 HIGHWAY 101 STE 2 PORT TOWNSEND JEFFERSON 2064228328 M-Su 10-8
CROCKPOT 1703 SE SEDGWICK RD STE 113 PORT ORCHARD KITSAP 2533127280 Tu-Su 9-9
CASCADE HERB COMPANY 1240 E MAPLE ST STE 103 BELLINGHAM WHATCOM 9082856086 M-Su 9-8
420 HOLIDAY 2028 10TH AVE LONGVIEW COWLITZ 5093030681 9/1/2014
ELLENSBURG APOTHECARY 1516 WEST UNIVERSITY WAY ELLENSBURG KITTITAS 5098335556 M-Sa 10-6
GREEN COLLAR 10422 PACIFIC AVE S STE B TACOMA PIERCE 2532670675 M-Su 10-10
CLEAR CHOICE CANNABIS 8001 S HOSMER ST TACOMA PIERCE 2534445444 M-Sa 10-7, Su 12-6
GREEN STOP 7466 MT BAKER HWY MAPLE FALLS WHATCOM 3603937702 Not Yet
HERBAL ACCESS RETAIL 661 NESS’ CORNER RD PORT HADLOCK JEFFERSON 3602977996 Not Yet
221 18729 FIR ISLAND RD STE C MOUNT VERNON SKAGIT 3604454221 M-Sa 10-8, Su 10-6
GREEN LADY 3044 PACIFIC AVE SE STE B OLYMPIA THURSTON 5098697574 M-Sa 10-8, Su 11-7
MARIJUANA MART 1405 YELM AVE E YELM THURSTON 3604801912 October
SAVAGE THC 4428 WILLIAMS VALLEY RD STE A CLAYTON STEVENS 5099992989 Tu-Su 12-8
GREEN LEAF 4220 MERIDIAN ST STE 102 BELLINGHAM WHATCOM 3603032860 M-Su 9-9
TOKEN HERB 837 A CRESCENT BEACH RD EASTSOUND SAN JUAN 3603766900 Not Yet
HIGH SOCIETY 1824 BROADWAY EVERETT SNOHOMISH 2063071651 9/15/14 (Hopefully)
LOVING FARMS 2615 OLD HIGHWAY 99 S MOUNT VERNON SKAGIT 3605405168 October
SMUGGLER BROTHERS 1912 STATE ROUTE 20 SEDRO WOOLLEY SKAGIT 3606473437 Late September/Mid October
CANNARAIL STATION 1448 BASIN ST NW SUITE A EPHRATA GRANT 5097541047 Su-Sa 10-10
SPOKANE’S GREEN DEPOT 71 N RALPH ST STE 102 SPOKANE SPOKANE 2532417773 Not Yet
CANNABLYSS 2705 HARTFORD DR STE A LAKE STEVENS SNOHOMISH 4253277529 Not Yet
SATIVA SISTERS 10525 E TRENT AVE STE 1 SPOKANE SPOKANE 2086603909 M-Su 12-9
I-502 CANNABIS STORE 3012 GS CENTER RD STE A WENATCHEE CHELAN 2817260614 Not Yet
THE GREEN SEED 8420 ASPI BLVD STE 3 MOSES LAKE GRANT 5098552271 Not Yet


August I-502 Legal Production Update and Analysis

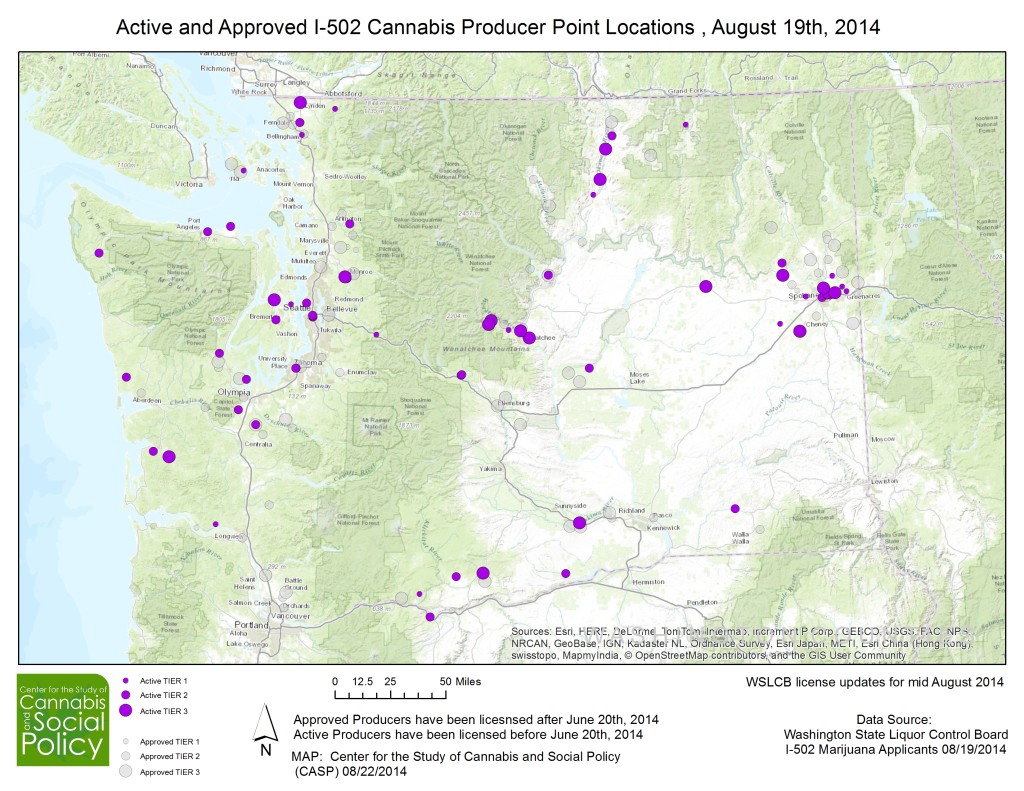
08232014 map

Map by Steve Hyde

Additional research provided by Danny Hackin

by Dominic Corva, Executive Director

*This late-August update uses the 8/19 Washington State Liquor Control Board list of “Marijuana License Applicants.”

The purpose of this post is to extrapolate from the most current data in order to map the legal cannabis production landscape and identify the scope and rate of active production for the I-502 market.  The map above shows you how the landscape is filling in by Tier, and differentiates “Active” from “Approved” producers by allowing for a 10 week lag between approval and approximate expected production.  The 10 weeks are a “rule of thumb” estimation rather than derived from any particular assessment for each producer.  We’ll start with a table that shows our estimation of Active max square feet of canopy by Tier, next to pending production, approved less than 10 weeks ago, next to the total Approved which should be Active around 10/24/2014.

Max Sq ft Canopy Active 8/24 Approved not Active yet Total Approved
Tier 1 23800 19600 43400
Tier 2 259000 280000 539000
Tier 3 378000 903000 1281000
All Tiers 660800 1202600 1863400

We have a maximum of 1,863,400 square feet of approved canopy, but only about a third of that should be considered active.  This means that in the next two months, we expect active production to increase by about 282% .  Most of that will be from Tier 3 producers, of which 18 out of 61 are currently active. The ratio of Tier 1:Tier 2:Tier 3 approval until two months ago was 17:37:18.  Since then it is 14:40:43.  Either the WSLCB is focusing on Tier 3 approval more or Tier 3’s are finding an easier path to approval for other reasons.  The upshot of this is that a LOT more canopy is being approved at a faster rate.  We can see this in the following two trend charts, trajectory of approved canopy and trajectory of active canopy.

This time we are pleased to supplement the map with a range of graphs to help policymakers and the public understand the rate of expected canopy activation rather than simply producer activation, and to project currently approved canopy to its expected dates of activation, once again by adding 10 weeks to individual approval dates.  Then, we will look at what that means in terms of market share among the Tiers.

AggregateActive AggregateApproved

*Pardon the charts, I had a problem exporting from googledocs to wordpress so I took screenshots*

The above charts help us understand how the rate of approval is a bit misleading: instead we want to add 2 months to the approval date to get approximate activation dates.  We expect the Aggregate Active Max Canopy on October 18th to match up with the Aggregate Approved Max Canopy on August 18th, more or less the latest entry in the WSLCB updates.

The reader can also see that the process is gaining momentum — certainly not a characteristic of a process that is “failing” in any way.What we see above is a logarithmic expansion that really takes off the beginning of June, when the first retail stores opened.  This was to be expected, given the WSLCB shifted resources to getting retail off the ground.  Now they are turning their limited human resources back to producer/processor approvals, perhaps especially focused on Tier 3s per the reasoning above.

The information provided also gives us a picture of market share by Tier, right now and two months from now.

8_24 Active Canopy 10_24Projected

Tier 3 Canopy is on its way to swallowing up market share, confirming CASP’s earlier statements that now is the best time for smaller producers to position themselves in the market, and to plan for substantial supply increases which will drive wholesale prices down.  This is a major reason why current active producers have a slightly different idea of what constitutes fair wholesale market pricing, compared with retailers.  One way they are resolving this tension is by establishing long term contracts at below-current market prices.

In the medium term, however, this analysis of production trends should be coupled with an analysis of retail store trends.  Wholesale “supply” is a function of retail demand, not consumer demand.  Retail demand will be increasing over time, though we are not sure at what rate right now.  So increased production won’t necessarily drive prices down — that depends on the rate of increased retail outlets.  Currently 46 retailers have been approved, and only some of these are open, and only a handful are able to stay open without running out of product.  With over 330 potential retail outlets under the current rules, we can’t confidently estimate when retail prices will come down.  We can, however, suggest that supply is increasing at a logarithmic rate; that October is non-indoor harvest time; and that 43 Tier 3’s are ramping up to harvest as we speak.

There is so much more to discover before we can really predict anything sophisticated about prices and supply.  My preliminary research suggests that most indoor producers are operating between 30-50% canopy, while greenhouse and full sun are closer in general to their maximum canopy.  For now, I would note that non-indoor spatial logic is mostly seasonal, while indoor spatial logic is mostly not.

We also need to know more about cycle variability, especially indoor.  Many indoor producers are staggering production so that they harvest more regularly than the 4-5 cycles upon which WSLCB rules are predicated.  They are trading flowering canopy space for steady revenue, so that affects how much becomes available for wholesale at any given time.

Finally, we would be remiss not to point out how far ahead Spokane and Okanagon seem to be in terms of approved producers (see intro map above).  Part of it might be the afrementioned possible focus on approving Tier 3’s right now, but it also may be the effect of organizing by potential I-502 producers to prepare their jurisdictions for a smoother transition.

We look forward to discovering so much more, and adjusting our analyses accordingly.