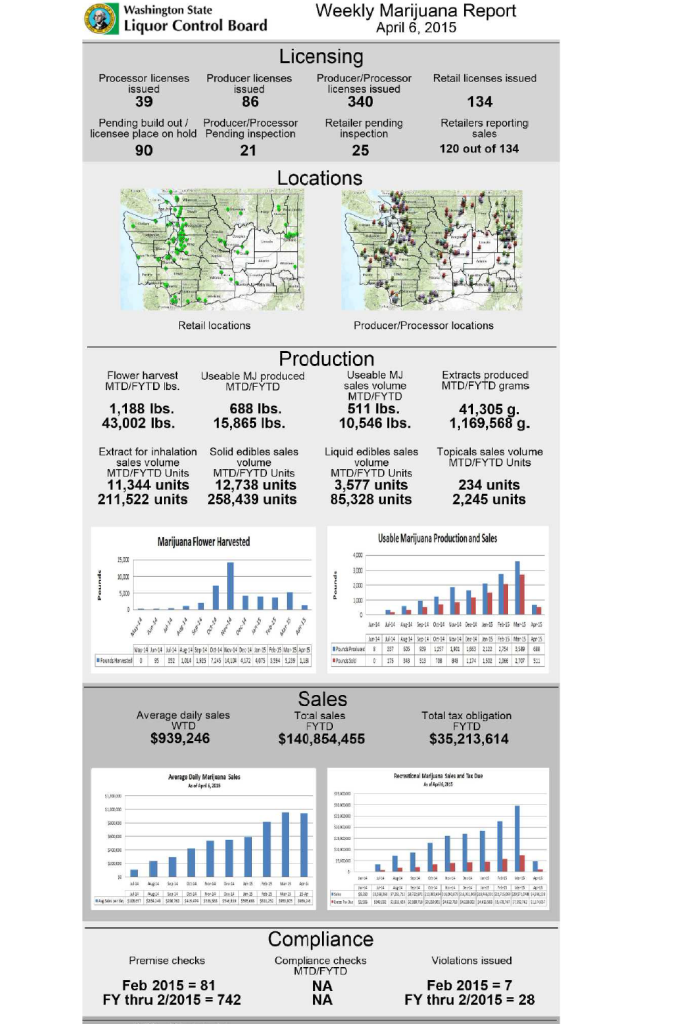
Infographic obtained through Spokane City Council WSLCB public records request. Many thanks to Blaine Stum for sharing it with us.
by Dr. Dominic Corva, Executive Director
Two weeks ago, the WSLCB released a massive raw Biotrack data dump to CASP and many other individuals and organizations that have been trying to track the emergence of Washington’s legal cannabis landscape. To my knowledge we are all — even private information organizations — still attempting to organize the data into coherent parts. In the mean time, CASP has been receiving requests for updates to publicly available information from the WSLCB “Frequently Requested Lists” site. This post is an effort to provide the best information we have right now, in response to rising public interest on the one hand and pending raw data processing on the other.
The infographic above is the only known document of its kind, possibly representing a document that will in fact be released on a weekly basis from the WSLCB to the public at large. While the licensing numbers are of particular interest and continuous with previously known data, I want to draw the reader’s attention to flower harvest and useable marijuana produced in this fiscal year.
According to the Washington State Board for Community and Technical Colleges, the state fiscal year is defined as follows: “State Fiscal Year = A 12-month period used for budget and accounting purposes. The state fiscal year runs from July 1 through June 30 of the following year, and is named for the calendar year in which it ends (e.g., July 1, 2013 through June 30, 2014 is state Fiscal Year 2014).”
Thus, the fiscal year to which this document refers runs from July 1, 2014 through June 30, 2015. This time period encompasses virtually all of the possible Washington State cannabis harvests and sales so far. Therefore, the numbers in this worksheet, if they are accurate, represent the best picture of the Washington State legal cannabis landscape to date. There are three items of particular interest.
1. The numbers represented here render all of the previous calculations done on this site and others obsolete, in terms of accuracy. According to this infographic, only 15,865 lbs of usable cannabis, which I am interpreting here as salable flower, has been harvested to date, meaning that the fall 2014 harvest flower glut could not possibly have been the product of a 30,000 lb outdoor harvest. Instead, it would seem the exaggerated volume from harvest reflects total cannabis produced (including raw material for extracts).
2. We are producing approximately 688 lbs usable flower /month, if we take this “April 6” update to represent March’s “MTD” rather than the six days of April. This seems like a reasonable conjecture, but can’t be taken as gospel at this point. That number should be taken as the current indoor capacity of the I 502 system, since we assume zero outdoor or greenhouse production this time of year (even though it’s possible and in fact likely that there are some hybrid greenhouses out there that have continued to produce through the winter).
3. The ratio of buds to raw material produced per plant was initially assumed to be 1:1 per WSLCB statements. But from these numbers we see that ratio is 43,002 lbs raw material to 15,865 lbs buds, or approximately 3:1 raw material to buds. This supports CASP’s insistence that processing for extraction (as opposed to making pre-rolls) is the name of the game and if your producer/processor license’s business plan ignores this basic fact then you aren’t maximizing your chance for success in what will be an increasingly competitive market.
We will go much further into the data when we figure out how to extract it from the files provided to us through our public information requests. I want to tip my hat to the WSLCB, which has had to deal with what appears to be a truly messy Biotrack reporting system, for deciding to go ahead and let the rest of us have a crack at it.
